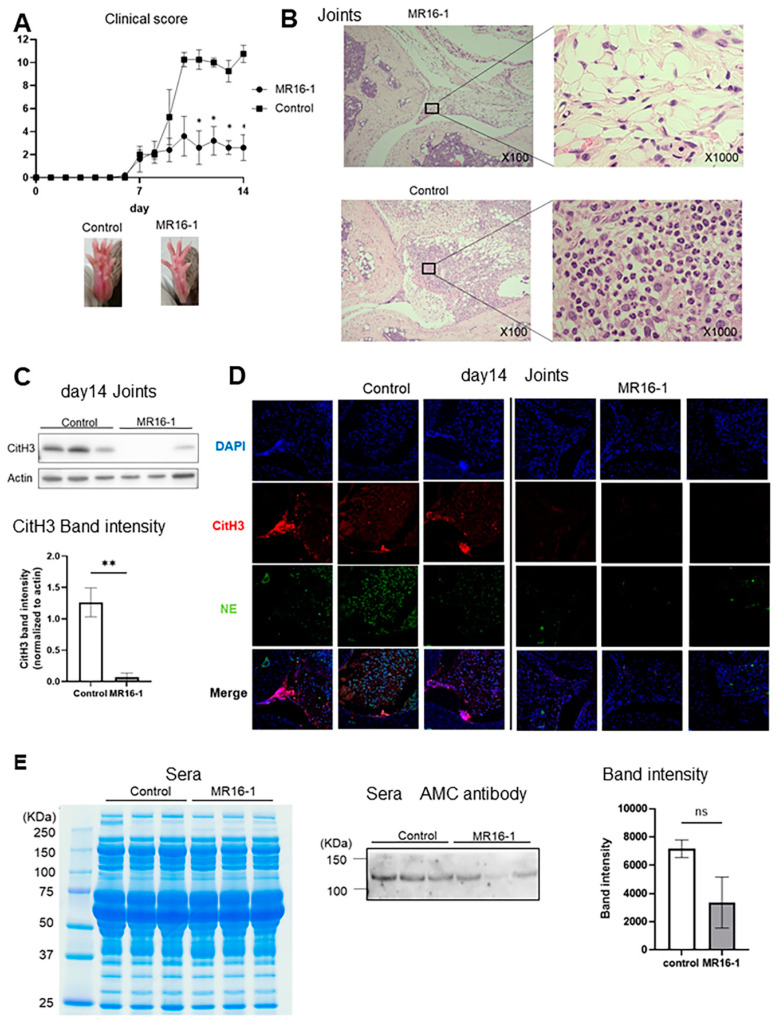
Figure 3.
Suppression of arthritis obtained by treatment with MR16-1 in pGIA mice. (A) Clinical scores (means ± SEMs) of pGIA mice treated with MR16-1 (n = 5) or control IgG (n = 4), and representative images of ankle joints of pGIA and control mice. p values were calculated using two-way ANOVA with the post hoc Sidak multiple comparisons test. (B) Representative images of hematoxylin–eosin staining of pGIA joints treated with MR16-1 or control IgG. (C) Western blot analysis of the joint lysates of pGIA mice treated with MR16-1 or control IgG using anti-CitH3 antibodies. Three mice in each group were analyzed. Bars show means ± SEMs. p values were calculated using the unpaired t-test; ** p < 0.01. (D) Immunofluorescence using anti-CitH3 antibodies and anti-NE antibodies were performed on joint sections from the pGIA mice treated with MR16-1 and from the control mice (representative images from 3 mice in each group). DAPI was used for DNA staining. (E) Sera from pGIA mice treated with MR16-1 and control IgG were separated by SDS-PAGE then stained with Coomassie brilliant blue (CBB) or subjected to Western blot analysis using anti-modified citrulline antibodies. Three mice in each group were analyzed. p values were calculated using the unpaired t-test.

