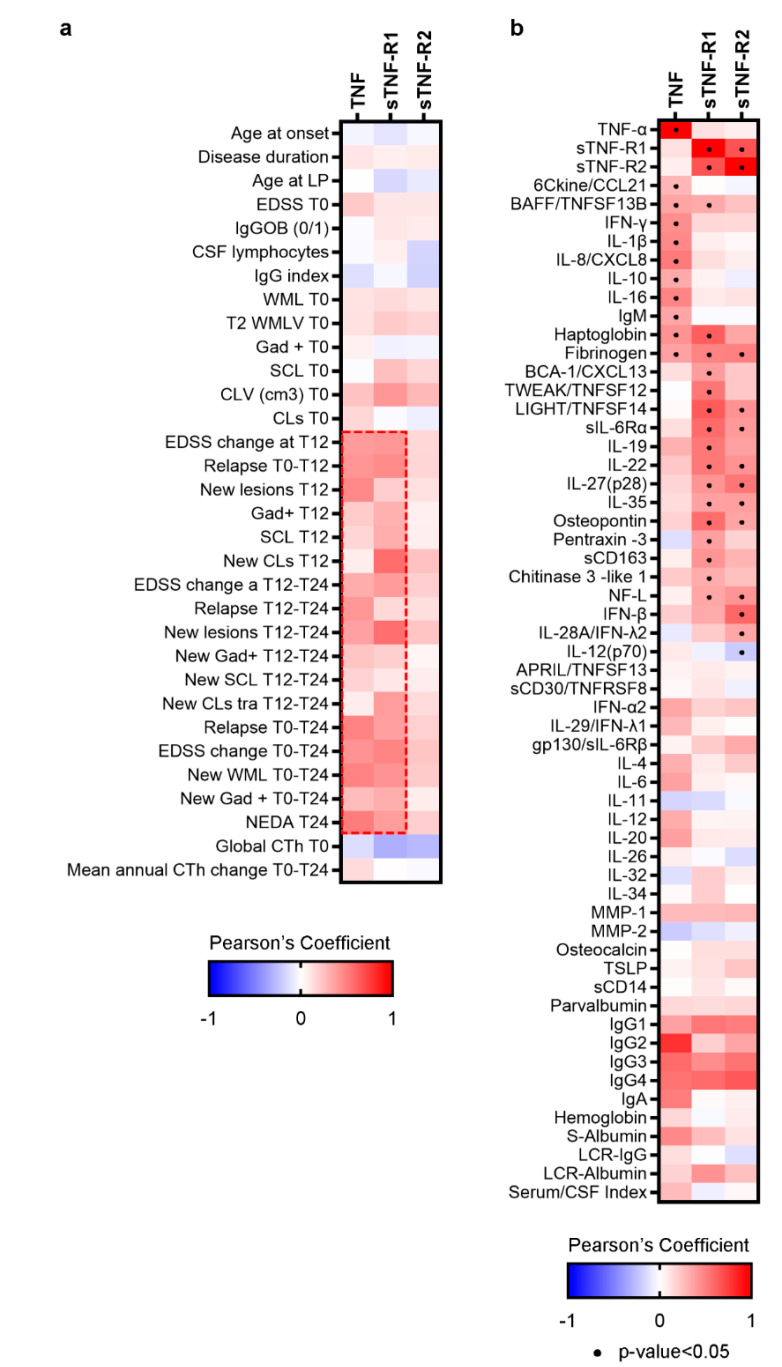
Figure 2.
(a). Matrix indicating significant correlations (Spearman) between the examined clinical and MRI parameters and the CSF levels of TNF and sTNFRs. Blue colour shows negative correlation, red colour shows positive correlation; strong colour tonality identifies a strong correlation. (b). Matrix indicating significant correlations (Pearson) between the CSF levels of TNF and sTNFRs and the other examined molecules. Blue colour shows negative correlation, red colour shows positive correlation; strong colour tonality identifies a strong correlation.

