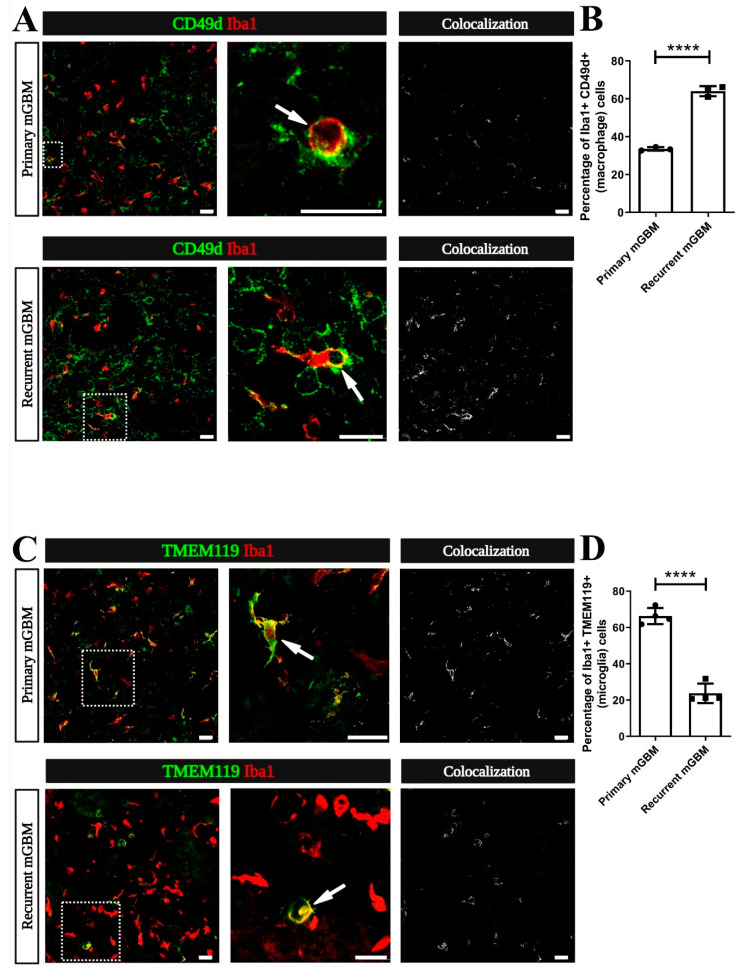
Figure 3.
The ratio of monocyte-derived macrophages (MDM) to resident microglia is increased in recurrent GBM. (A–D) Sections from GBM models reaching the pre-defined experimental endpoint (symptomatic mice) were co-immunostained for the myeloid cell marker Ionized Calcium-Binding Adapter Molecule 1 (Iba1; red), the MDM-marker CD49d or for the microglia-marker Transmembrane Protein 119 (TMEM119) Staining for CD49d or TMEM119 is presented in green. (A) Representative micrographs of TAM in primary and recurrent murine GBM (mGBM) are shown in the left panel. A CD49d+Iba1+ double-positive (yellow) MDM (dashed rectangle) is magnified in the middle panel (arrow). In the right panel, Colocalization figures, obtained by the RG2B Colocalization plugin from ImageJ, indicate an increase of the CD49d+Iba1+ macrophage staining in recurrent compared to primary mGBM. (B) Quantification of the numbers of CD49d+Iba1+ macrophages was performed and compared to the total number of Iba1-positive TAM. The percentage of MDM in all TAM increased from 33.54% in primary mGBM to 64.01% in recurrent mGBM. Number of mGBMs analyzed was n = 3 per group. (C) Representative images depict tumor-associated TMEM119+Iba1+ double-positive (yellow) microglia (dashed rectangle) in primary and recurrent GBM (left panel). A magnified colabeled microglia is shown in the middle panel (arrows). In the right panel, “Colocalization” figures indicate a decrease of the TMEM119+Iba1+ microglia staining in recurrent compared to primary mGBM; (D) Quantification of the number of TMEM119+Iba1+ microglia was performed compared to the total number of Iba1-positive TAM. The percentage of microglia in all TAM decreased from 66.27% in primary GBM to 23.74% in recurrent mGBM. Number of mGBMs was n = 4 per group. (B,D) Statistical significance was calculated by student’s t-test, **** indicating p < 0.0001. Each dot in the diagrams represents the average statistical value obtained from one mouse. Scale bars represent 20 µm (A,C).

