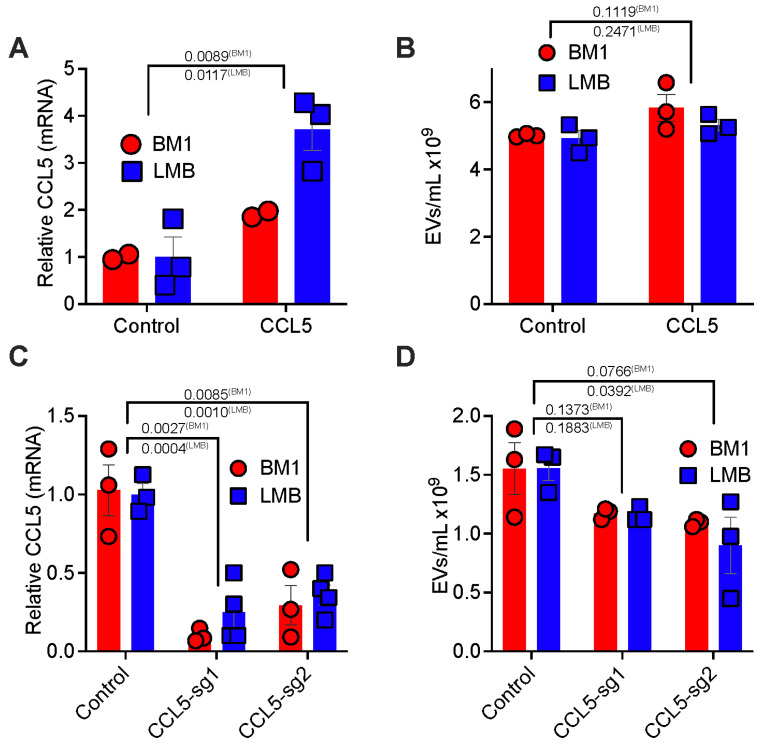
Figure 4.
Tumor CCL5 expression regulates EV secretion (A) qRT-PCR of CCL5 in BM1 using GAPDH as loading control or ddPCR of Ccl5 in LMB cells. Relative expression of CCL5/Ccl5 in CCL5 over-expressing cells (CCL5) is compared to those with a control vector (Control). p-value was determined using a two-tailed t-test (N = 3). (B) Number of EVs/mL determined by NTA analysis using a Nanosight in BM1 and LMB cells either expressing a control vector (control) or CCL5 over-expressing (CCL5). p-value was determined using a two-tailed t-test (N = 3). (C) qRT-PCR of CCL5 in BM1 using GAPDH as loading control or ddPCR of Ccl5 in LMB cells. Relative expression of CCL5/Ccl5 in BM1 and LMB cells using CRISPR/Cas9 KO (BM1) or CRISPR/dCas9-KRAB (LMB). CCL5 reduced cells (sg-1, sg-2) are compared to those with a control vector (Control). p-value was determined using a one-way ANOVA (N = 3). (D) Number of EVs/mL determined by NTA analysis using a Nanosight in BM1 and LMB cells either expressing a control vector (control) or CRISPR/Cas9 KO (BM1), CRISPR/dCas9-KRAB (LMB) with a CCL5/Ccl5 targeting guide RNA (sg-1, sg-2). p-values were determined using a one-way ANOVA (N = 3).

