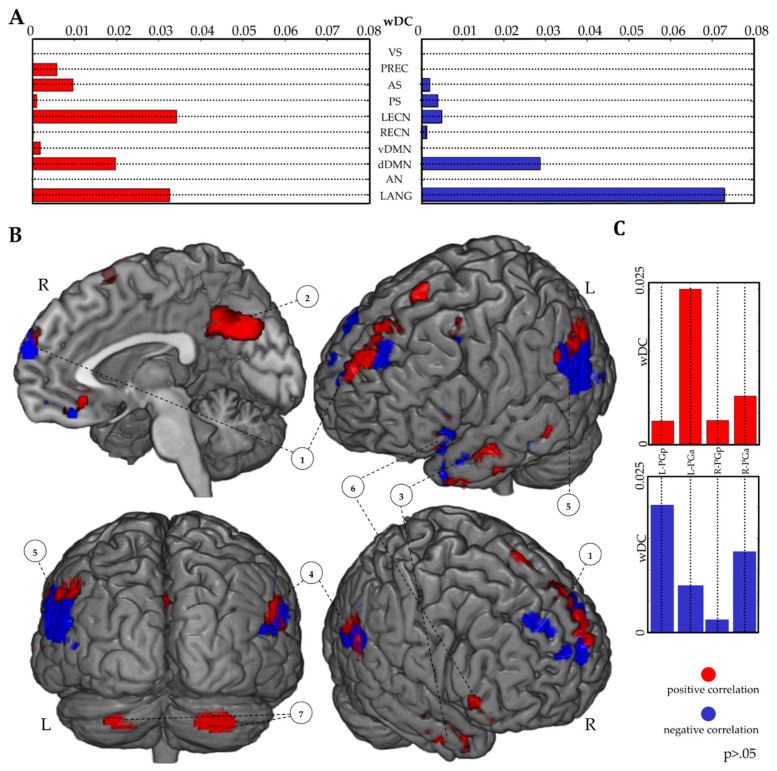
Figure 4.
Performance-based analysis results. wDC analysis results using suprathreshold correlational maps (p > 0.05; FR > BC contrast; IR as a covariate of interest) and functional RSNs (A). Suprathreshold correlational maps (p > 0.05; FR > BC contrast; IR as a covariate of interest) are reported (B). wDC analysis results between suprathreshold correlational maps and AG of the IPL parcellation atlas (C). A positive correlation is shown in red; a negative correlation is shown in blue. 1: Bilateral Superior/Medial Frontal Gyrus; 2: Precuneus and PPC; 3: Left Middle Temporal Gyrus; 4: Left IPL; 5: Right IPL; 6: Left Inferior Frontal Gyrus; 7: Bilateral Cerebellum.

