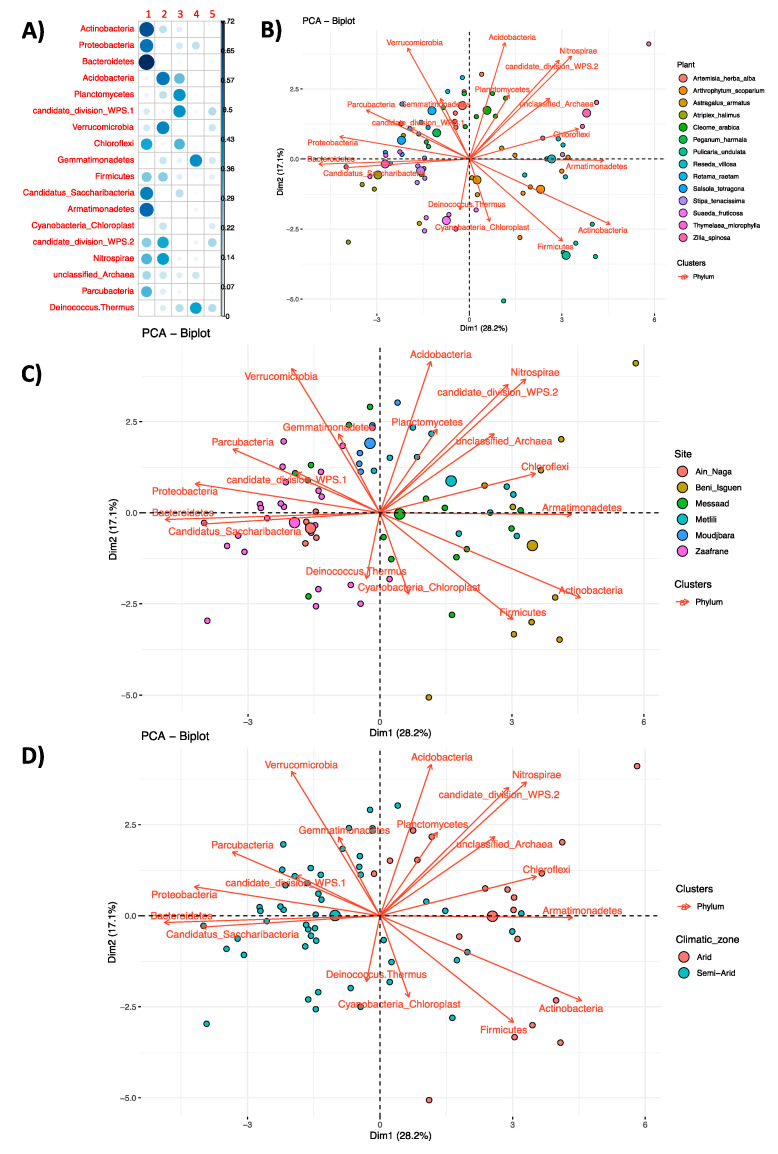
Figure 5.
PCA. (A) Cos2 contribution of different phyla on PCA dimensions (1, 2, 3, 4, 5). PCA graphs according to plant, sampling site and climatic zone factors. (B) PCA-Biplot at phylum level according to plant species; (C) PCA-Biplot at phylum level according to sampling site; (D) PCA-Biplot at phylum level according to climatic zone. Each bigger dot represents the mean value for each considered parameter while each little dot represents each considered sample.

