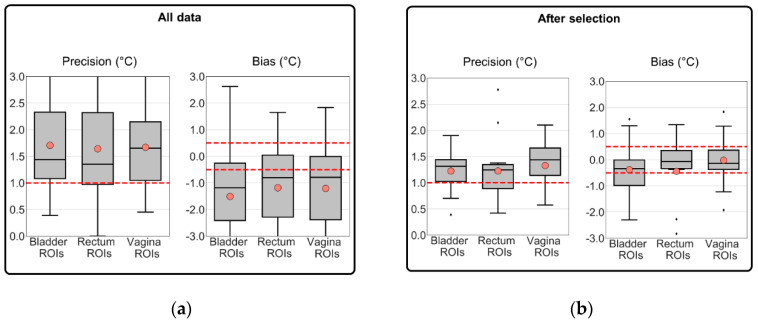
Figure 7.
Evaluation of MR thermometry precision and bias in (a) all treatment sessions and (b) in the group of selected treatment sessions. The MR thermometry was calculated for the three intraluminal locations. The evaluation of MR thermometry was based on the voxels remaining after filtering and data used in the analysis. The dashed red line represents the acceptable mean accuracy threshold (1 °C) and, in light red circles, the mean MR thermometry accuracy in each location. The inter-quartile range denotes the middle 50% of the dataset. The top box shows 75% of the dataset that falls below the upper quartile, while the bottom line consists of 25% of the dataset that falls below the lower quartile. The middle line represents the median value, and the line extending from the box represents 2.5% and 97.5% limits of the dataset.

