Figure 5.
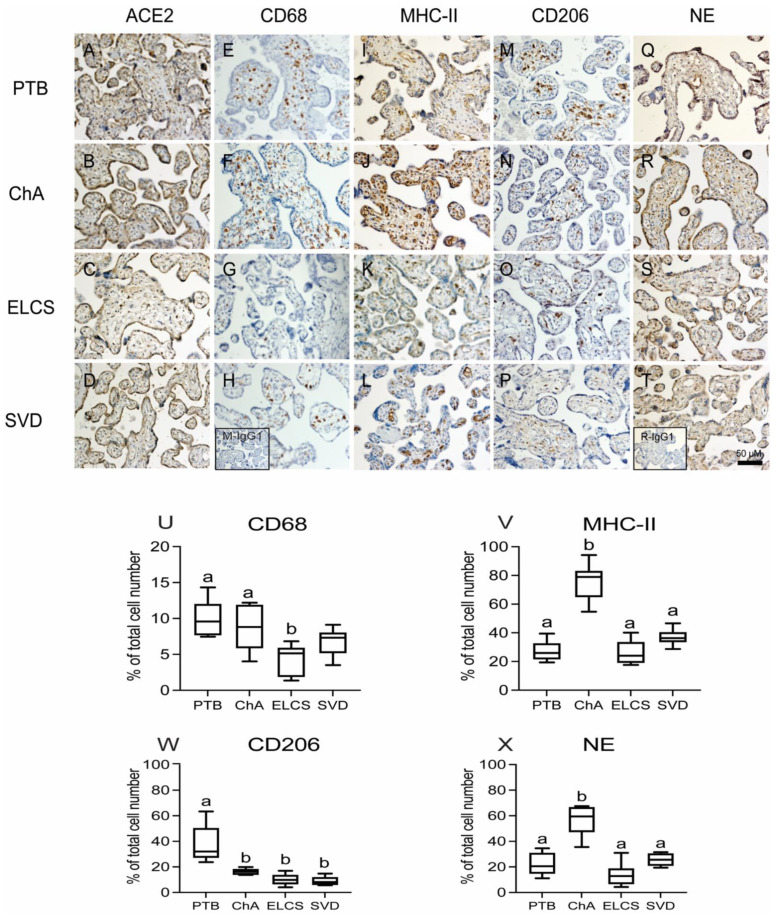
Localization and quantitation of placental ACE2, CD68 (macrophage marker), MHC-II (M1 marker), CD206 (M2 marker) and neutrophil (NE) staining in complicated and uncomplicated pregnancies. Representative images of ACE2 (A–D), M1 (MHCII E–H), M2 (CD206 I–L), CD68 (M–P), and NE (Q–T) staining in preterm and term placentas (n = 6 in each group). Inserts (bottom left) in H mouse IgG1 and T rabbit IgG1 isotype control staining. Scale bar represents 50 μm. Image analysis quantitation of positively stained immune cells as a proportion of the total cells number was performed on a randomly selected 5% of the total tissue area of each placental section. (U) CD68 (V) M1 (W) M2 (X) NE. Statistical differences were tested by Tukey’s multiple comparisons test. Data are presented as mean ± SEM. Different letters indicate a difference between groups of p < 0.05.

