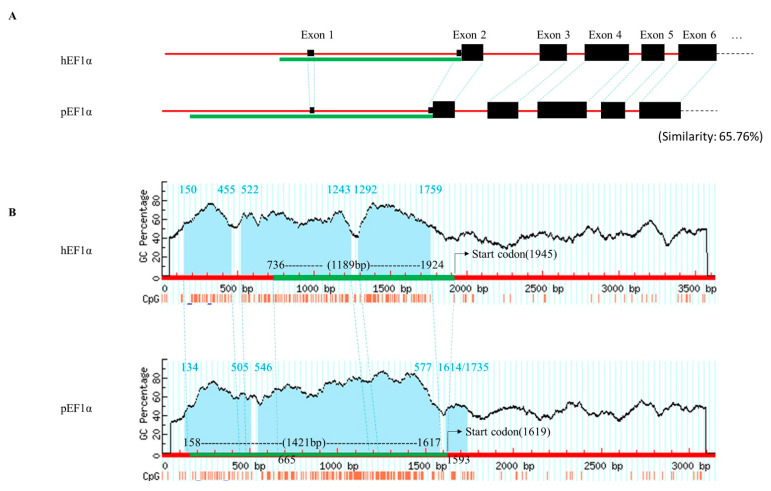
Figure 1.
Sequence alignment of hEF1α and pEF1α, including the URS. (A) Structure comparison of the selected URS (red lines) of hEF1α and pEF1α. Exons are shown in black boxes. (B) Pairwise alignment of the URS of hEF1α and pEF1α. Three predicted CpG islands are filled with blue and indicated as numbers on top of the graph. Location of the CpG dinucleotides is indicated by vertical red bars under the x-axis. Ortholog gene sequences of pEF1α and hEF1α are connected on the map with dotted blue lines. Green lines indicate the locations of the promoters used in the current study. hEF1α, human elongation factor 1α; pEF1α, porcine elongation factor 1α; URS, upstream regulatory sequence.

