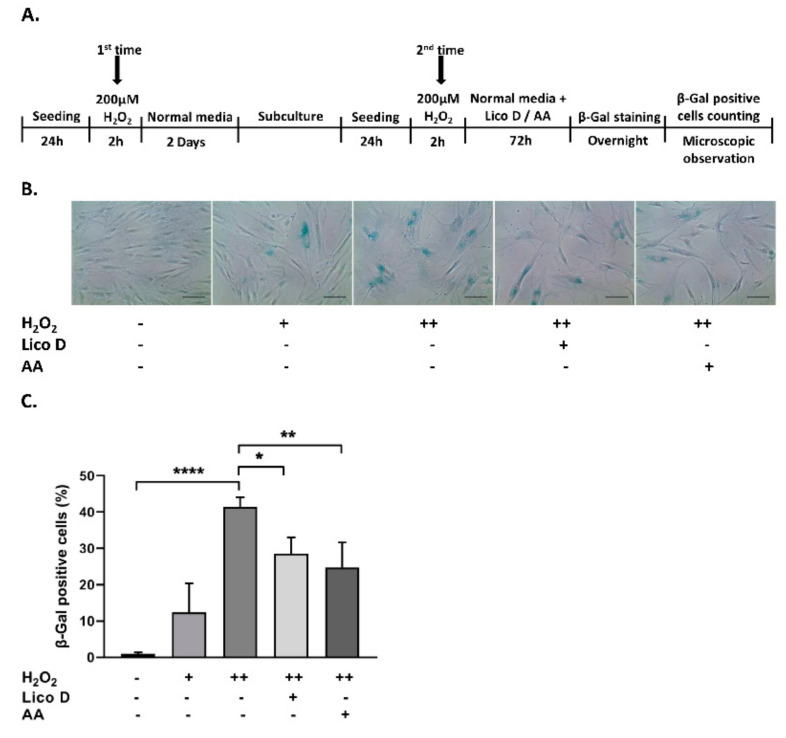
Figure 2.
Effect of Lico D in oxidative stress induced senescent hBM-MSCs. (A) Graphical representation of the oxidative stress induced senescence in hBM-MSCs. (B) Representative image of SA-β-gal positive cells and (C) percentage of SA-β-gal positive cells in oxidative stress induced senescence model. H2O2 (+) represents one-time treatment and H2O2 (++) represents double time treatment. The scale bar represents 100 µm. All data are represented as mean ± SD (n = 3) * p < 0.05, ** p < 0.01, and **** p < 0.0001.

