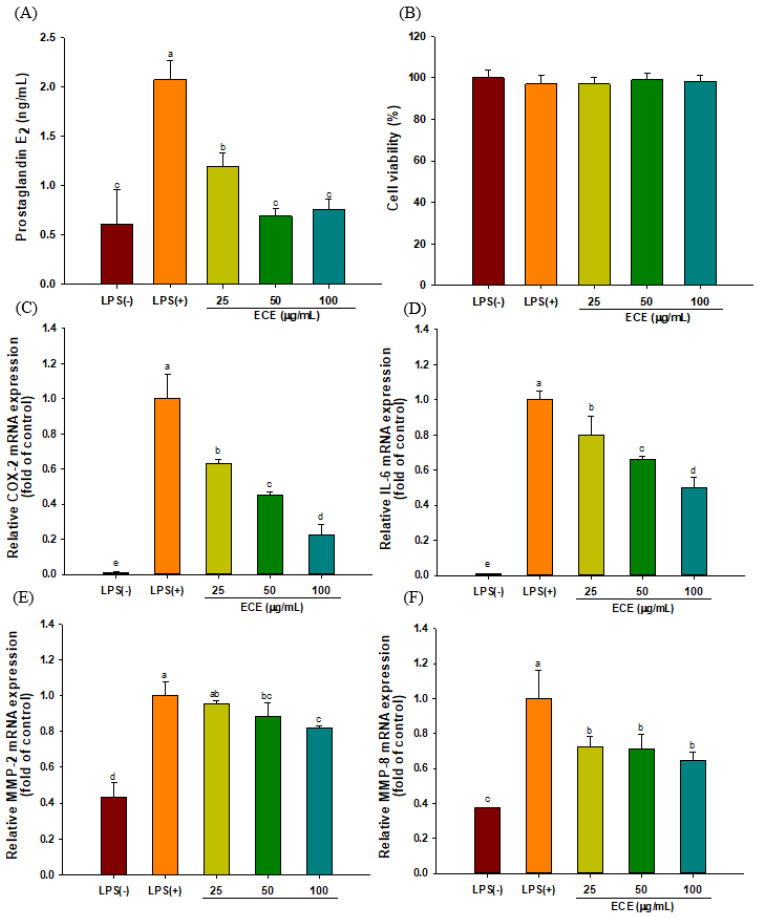
Figure 1.
Effect of ECE treatment on (A) PGE2, (B) cell viability, (C) COX-2, (D) IL-6, (E) MMP-2, and (F) MMP-8 mRNA expressions in LPS-stimulated HGF-1 cells. Cells were incubated for 24 h in the presence of LPS (5 μg/mL) and ECE. Different letters (a–e) show significant difference (p < 0.05). ECE: Ecklonia cava extract; PGE2: prostaglandin E2; COX-2: cyclooxygenase-2; IL-6: interleukin-6; MMP-2: matrix metalloproteinases-2; MMP-8: matrix metalloproteinases-8; LPS: lipopolysaccharide; HGF: human gingival fibroblasts.

