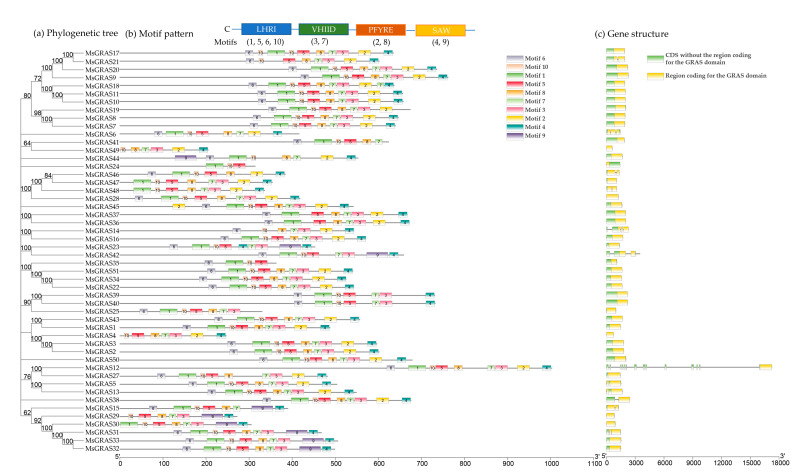
Figure 3.
Phylogenetic relationship, motif pattern, and gene structure of MsGRAS genes. (a) Phylogenetic tree of MsGRAS was constructed based on the full-length sequences of proteins using MEGA-X [34] based on the neighbor-joining (NJ) method. Bootstrap values for 1000 replicates were shown above the lines. (b) The motifs of M. sativa GRAS proteins predicted by MEME and plotted in TBtools. The motifs of 1–10 are displayed in different colored boxes. The protein length can be estimated using the scale at the bottom. The schematic of four conservative domains at the C-terminal regions of the MsGRAS members was combinations of motifs. (c) Gene structure of MsGRAS genes. Region coding for the GRAS domain (yellow) was determined in Batch Web CD Search Tool (BWCDST) on the NCBI website and plotted in TBtools software. “CDS without the region coding for the GRAS domain” (green), where the coding region does not cover the GRAS domain, are plotted based on the alfalfa genome annotation. gff file, which was input into TBtools together with hit export from BWCDST.

