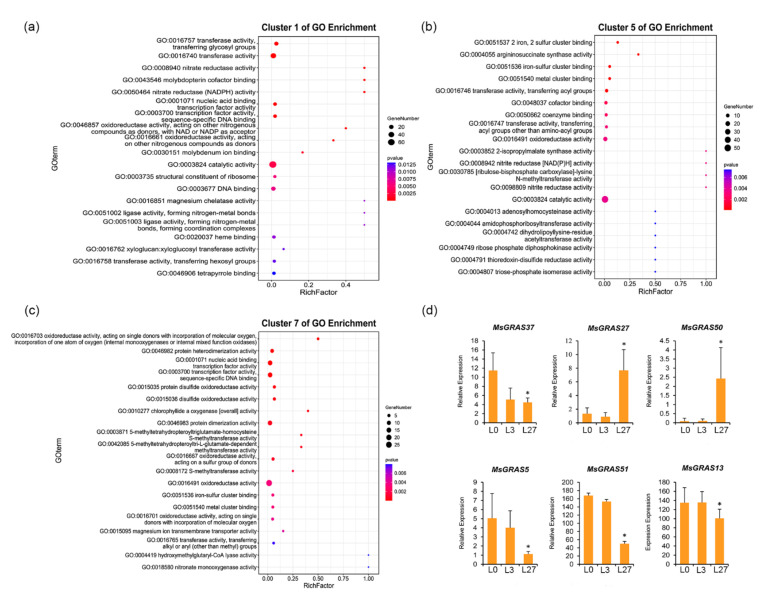
Figure 8.
GO enrichment analysis of DEGs shared by clusters of 1, 5, 7 and the relative expression of MsGRAS genes of #5, 13, 27, 37, 50, 51. (a) Cluster 1 of GO enrichment. (b) Cluster 5 of GO enrichment. (c) Cluster 7 of GO enrichment. (d) Expression profiles of MsGRAS genes of #5, 13, 27, 37, 50, 51 from RNA-seq data (* p < 0.05, Student’s t-test).

