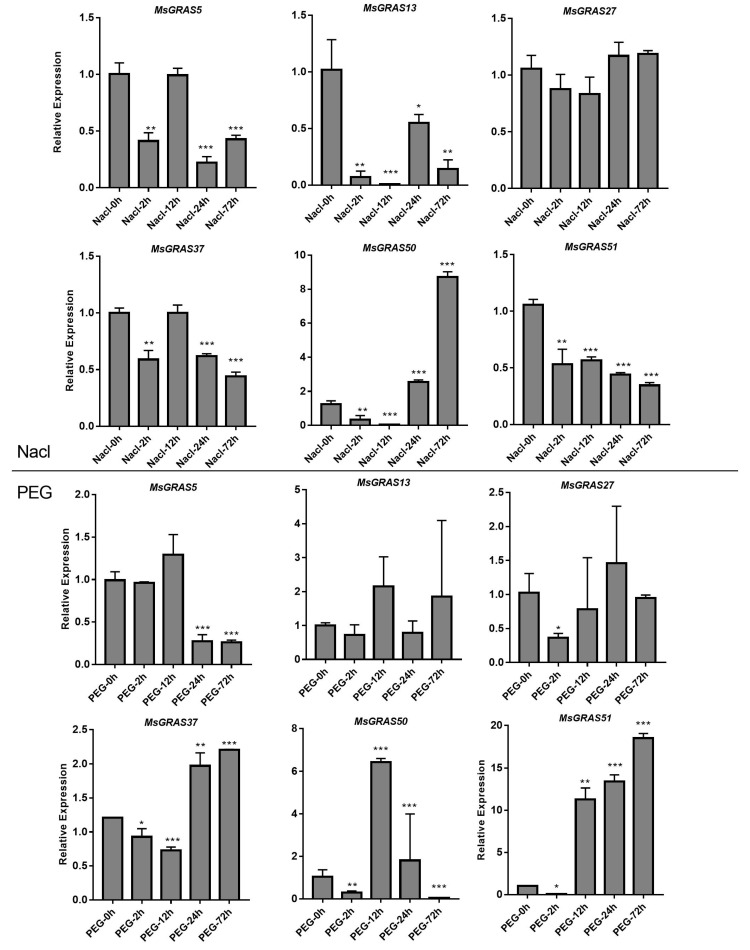
Figure 9.
Expression profiles of six selected MsGRAS genes in response to salt and drought stress treatments. Expression levels are normalized to Ms-ACTIN, and error bars indicate standard deviation among three biological replicates. Asterisks indicate the corresponding genes were significantly up-regulated or down-regulated compared with the control (* p < 0.05, ** p < 0.01, *** p < 0.001; Student’s t-test).

