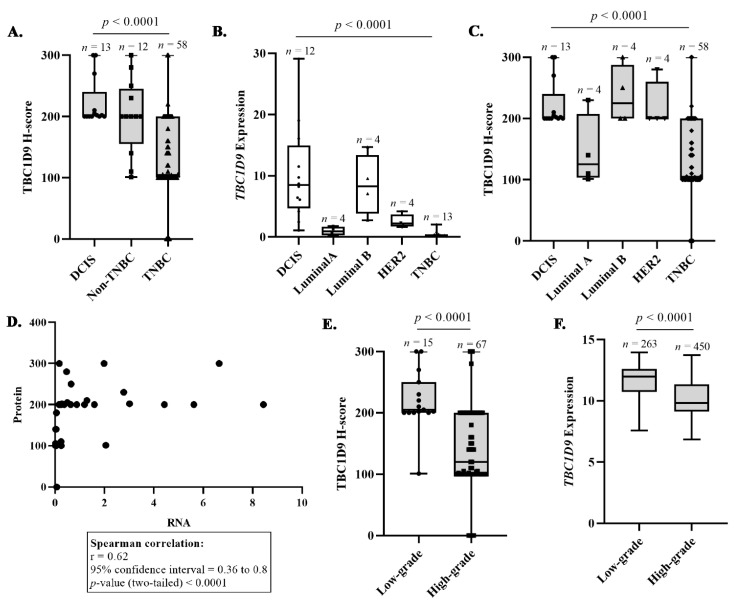
Figure 2.
Analysis of TBC1D9 expression in BC cohorts. The differences in the expression patterns of TBC1D9 in DCIS, non-TNBC, and TNBC tissue samples in our cohort (A). Expression of TBC1D9 in different subtypes of BC: DCIS (n = 12), luminal A (n = 4), luminal B (n = 4), HER2 (n = 4), and TNBC (n = 13) (B). Expression of TBC1D9 in different subtypes of BC: DCIS (n = 13), luminal A (n = 4), luminal B (n = 4), HER2 (n = 4), and TNBC (n = 58) (C). Spearman correlation between mRNA and protein expression of TBC1D9 in BC tissue samples from our cohort (D). Expression pattern of TBC1D9 in BC tissue samples according to grade in our cohort (E) and a cohort from the online database GENT2 (F).

