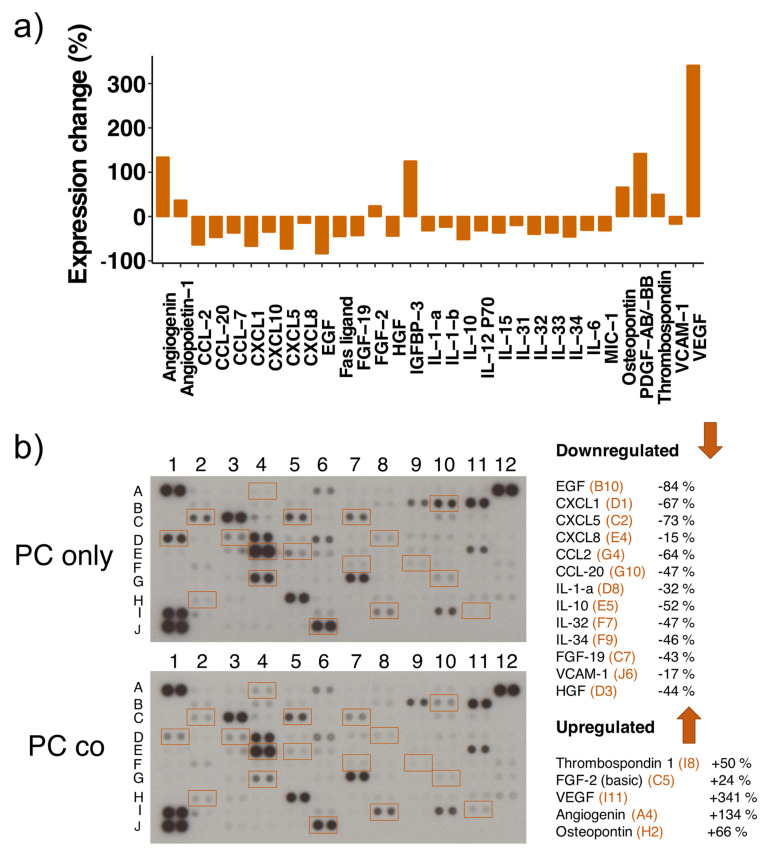
Figure 5.
Differential expression of several cytokines in mono- and co-cultured pericytes (PCs). Cytokine proteome analysis has been performed with the Proteome Profiler Human XL Cytokine Array Kit using equal amounts of cell lysates from PCs cultured alone (PC only) and in co-cultures with endothelial cells (PC co). Experiments were performed twice with independently prepared samples. The bar graph shows the changes in protein expression levels in % between co- and mono-cultured PCs (positive values: increased expression in co-culture, negative values: decreased expression in co-culture) (a). Included are results from 5- and 10 min array blot exposure and only proteins regulated accordingly in both experiments are shown in the bar graph. Representative array blots are shown after an exposure time of 5 min (b). Array blots from both experiments and exposure times are shown in Supplementary Figure S3. The legends on the right of the array blots denote the regulated proteins together with the coordinates for their location on the blots in orange.

