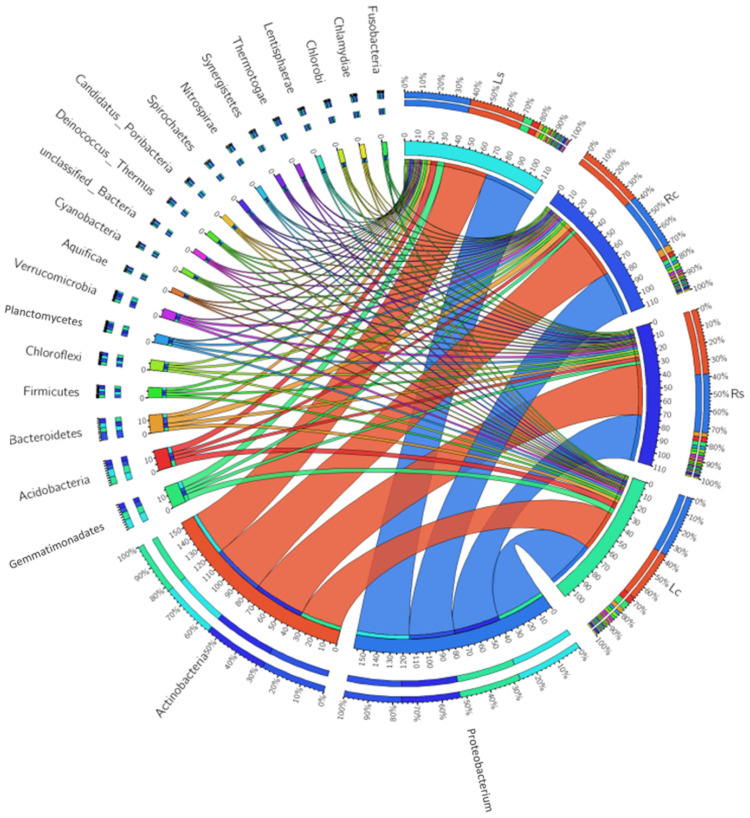
Figure 1.
The relative abundance of bacterial phyla in maize rhizosphere and the bulk soils. Ls—Lichtenburg rhizosphere sample, Lc—Lichtenburg bulk (control) sample, Rs—Randfontein rhizosphere sample, Rc—Randfontein bulk (control) sample. In the circus plot, the maize rhizosphere and bulk samples were arranged radially and the percentages of each phylum represented with color chords linking them together. For example, the color chords of Proteobacteria and Actinobacteria were larger than other phyla and their percentages can be viewed at the edge of each sampling sites and controls.

