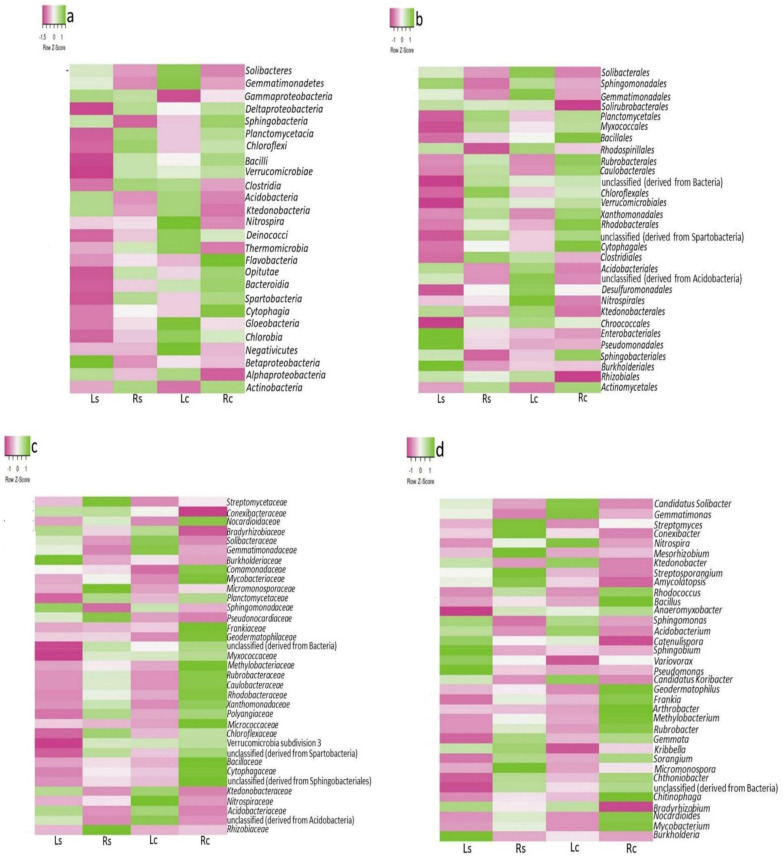
Figure 3.
Heatmap of maize rhizosphere bacterial community: Class (a), Order (b) Family (c) and Genus (d). The color saturation (z-score) represents the relative abundance of three replicates deduced from the maize rhizosphere (Ls and Rs) and bulk (Lc and Rc) soils. All statistical analyses, including mean values and analysis of variance (ANOVA) were done using GraphPad Prism (v5.0) as shown in Table S1.

