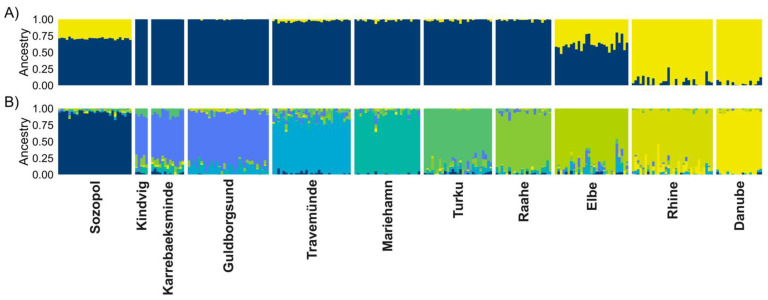
Figure 5.
Individual ancestry estimates using sNMF of 264 round gobies (Neogobius melanostomus) based on 13,847 SNPs, for (A) K = 2 and (B) K = 9. Each vertical bar represents one individual; the colour represents the proportion of that individual assigned to the different K clusters. Clusters 3–8 can be found in the Supplementary Figure S1.

