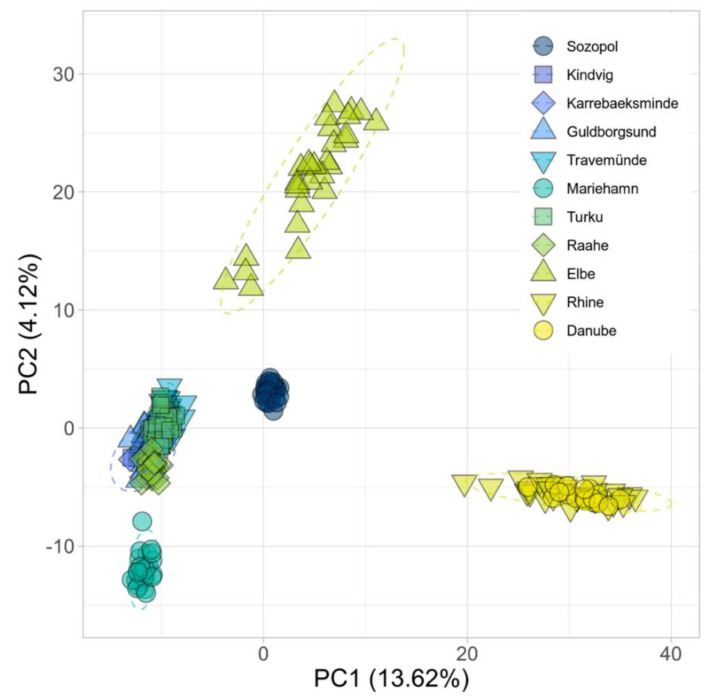
Figure 6.
First (x-axis) and second (y-axis) component of a principal component analysis (PCA) on the genetic relationship of 264 round gobies (Neogobius melanostomus) calculated from 13,847 SNPs. The first component explains 13.62% of the total variation and the second explains 4.122%. Each point represents one individual, colours represent sampling origin and shape is used for better distinction between sites. Dashed ellipses show 95% confidence intervals for multivariate normal distributions. The complete visualizations of principal components 1–3 can be found in Supplementary Figure S2.

