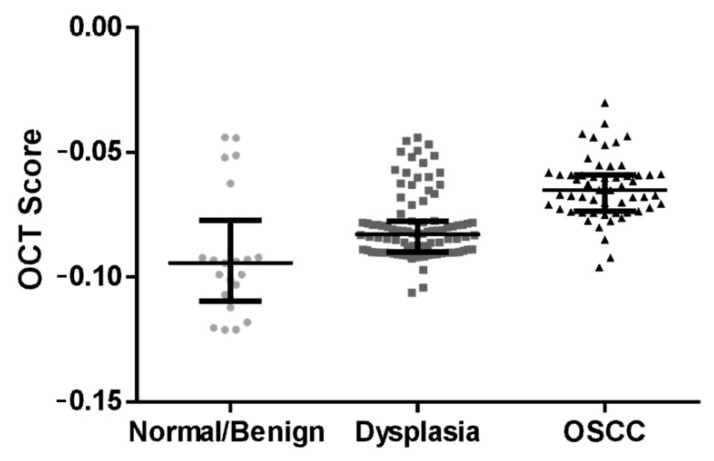
Figure 4.
OCT algorithm prediction score distribution between the different patient cohorts. Box and whisker plot depicting the algorithm scores of oral squamous cell carcinoma (OSCC), dysplasia and normal/benign lesions. The score significantly increases (p < 0.005) as the disease progresses. Graph shows median and inter-quartile range.

