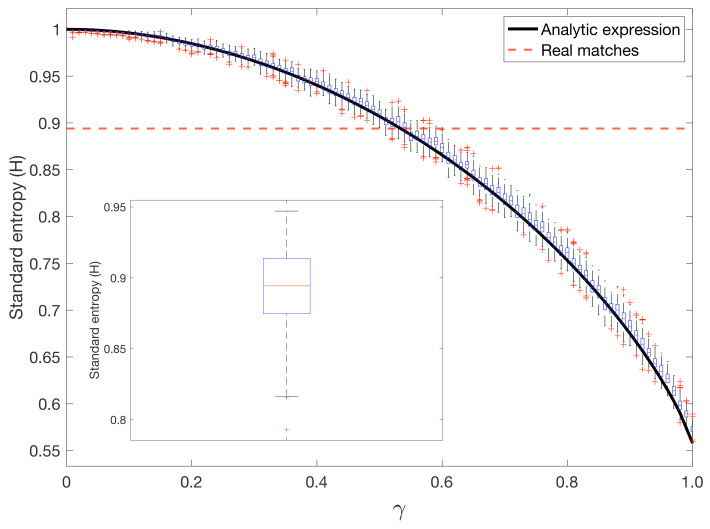
Figure 6.
From random to four-corner striking patterns. A parameter controlled the amount of randomness of the striking positions. For , the hitting positions were purely random, whereas a player was always striking from the four corners when . For each value of , each of the matches was simulated, while maintaining the same number of strokes. Each match was simulated 100 times. On each box, the central mark indicates the median, and the bottom and top edges of the box indicate the 25th and 75th percentiles, respectively. The red dashed line corresponds to the average standard entropy of the real matches . The inset shows the boxplot corresponding to the distribution of the standard entropy of the real matches (median, 25th, and 75th percentiles and outliers). Finally, the solid black line corresponds to the analytical expression of the simulated Standard Entropy (see Equation (4)).

