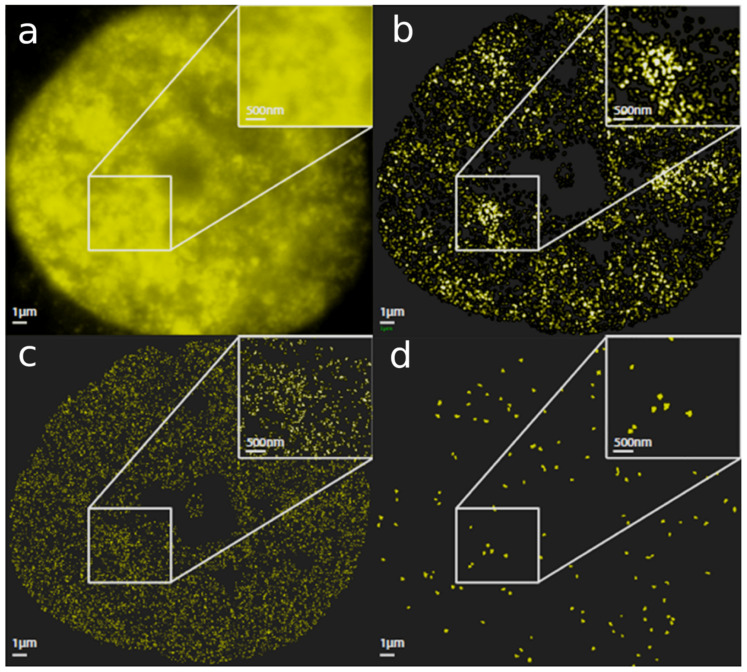
Figure 2.
Resolution of the heterochromatin network reconstructed from loci data of fluorescent molecules of an H3K9me3-stained breast cancer SKBr3 nucleus in a localization microscope. The images of an SkBr3 (breast cancer cell line) cell nucleus show: (a) A fluorescence wide-field image after heterochromatin staining with specific antibodies against H3K9me3 methylation sites. The inset shows a magnification of a region around small alveoli. (b) The same cell nucleus reconstructed from the localization data of the single fluorescence molecules as a density map. This means that point intensity relates to the number of neighbors. Due to soft focus filters, details of molecular arrangements are lost, but high (knots) and low (alveoli) density structures can be easily detected. Such image reconstructions based on density histograms are similar to conventional microscope images and allow a comparison to other techniques in many cases. The insert indicates that the shapes obtained by standard microscopy can be resolved into heterochromatin arrangements of different shape and molecular density. (c) Full pointillist localization image of all fluorescent molecules detecting H3K9me3 sites. Such images are obtained from data sets that are the basis for all quantitative structure and topology analyses using mathematical algorithms of statistics, geometry, and topology. The inset qualitatively indicates that the high-density knots revealed a structured folding. (d) Cluster image as a result of mathematical operations on the localization data set (visualized in (c)). The image only shows the areas that met a certain cluster parameter. The insert indicates that the dense heterochromatin regions consisted of clusters embedded in heterochromatin structures shown in (c).

