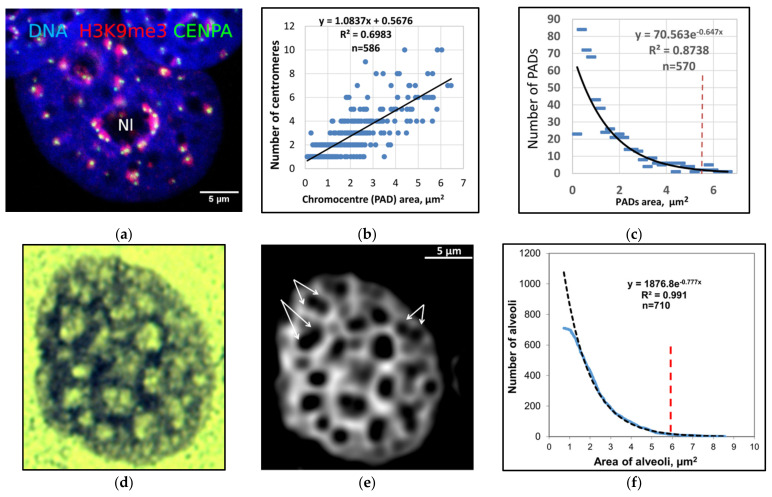
Figure 3.
The features of PADs and their network show a scale-free distribution in control MCF7 cells. (a,b) H3K9me3-positive PADs are clustered by centromeres, Nl—nucleolus; (c) the area and number of individual PADs clustered by centromeres and the negative exponential relationship between the area and number of individual PADs, with the dashed boundary of the largest likely static PADs; (d) preferential staining of heterochromatin by toluidine blue (method from [61]); (e) the filtered image of the same nucleus revealed the heterochromatin network with typical double alveoli (double-arrowed); (f) the negative exponential relationship between the area and the number of individual network alveoli with a set dashed boundary for the largest ones; (a–c) republished from [44].

