Figure 4.
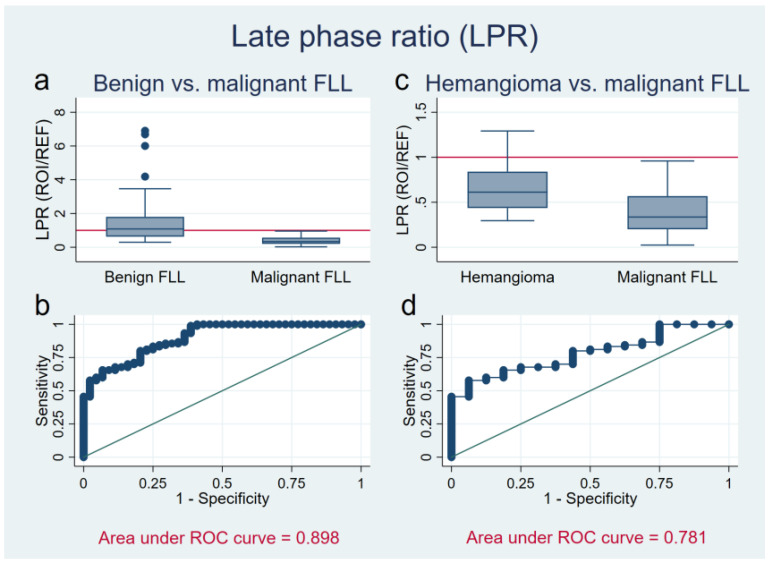
Late phase ratio (LPR) of benign liver lesions (a,b), and in a subgroup analysis of hemangiomas (c,d) versus malignant focal liver lesions (FLL). (a,c) The Y axis shows the LPR (region of interest/reference) of benign (a) FLL and hemangiomas (c) in comparison to malignant FLL. Red reference line at 1, values below indicating hypoechogenicity, values above hyperechogenicity. For malignant tumors, the ratio lies below 1 and therefore differ significantly (p < 0.001) from benign FLL (a). Hemangiomas present variable, in many cases mildly hypoechoic. Still, they differ significantly from malignancies (p < 0.001) (c). (b,d) ROC curve of LPR (X axis: 1-Specifity; Y axis: Sensitivity) in discriminating malignant from benign liver lesions (Area under ROC curve = 0.898) (b), and malignant lesions from hemangiomas (Area under ROC curve = 0.781) (d).

