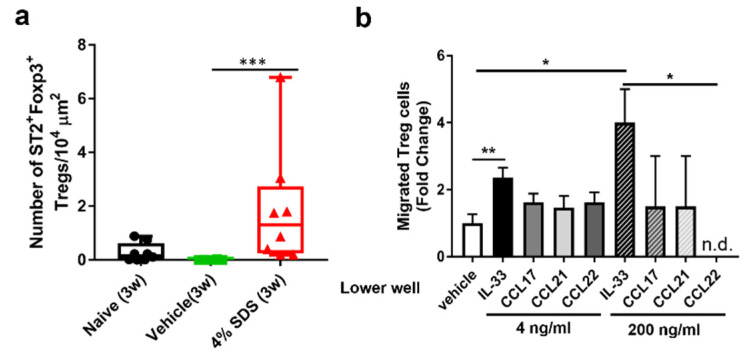
Figure 5.
Effects of IL-33 on Treg migration. (a) mRNA expression by ST2+ Foxp3+Treg cells detected by in situ hybridization; n = 6–8. *** p < 0.001 compared with naïve or vehicle-treated mice by the Kruskal–Wallis with Dunn’s multiple-comparison test. Scale bars, 100 μm. (b) Transwell migration assay of Tregs was performed. The number of cells that migrated into the lower chamber after a 2-h incubation at 37 °C is shown; n = 2–8 chambers in each group. Numbers represent the mean ± SEM of five independent experiments. * p < 0.05 and ** p < 0.01 compared with vehicle by the Kruskal–Wallis with Dunn’s multiple-comparison test.

