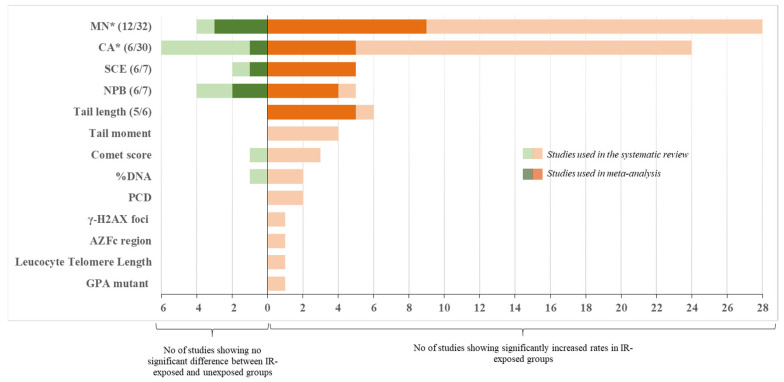
Figure 2.
Summary chart of the included studies. Shown are numbers of studies broken by endpoint. Studies that reported significant increase in endpoints in IR-exposed groups are plotted to the right of the X = 0, whereas studies showing no difference are plotted to the left. Studies used in meta-analysis are shown in dark color and their numbers are also shown in the brackets (e.g., 6/7 means 6 out of 7 total studies qualified and were used in meta-analysis). * Correlation of the endpoint with other confounding factors (alcohol consumption, smoking) were reported (see text for detail). AZFc: azoospermia factor region c; CA: chromosome aberration; GPA: glycophorin A; MN: micronucleus; NPB: nucleoplasmic bridge; PCD: premature centromere divisions; SCE: sister chromatid exchange.

