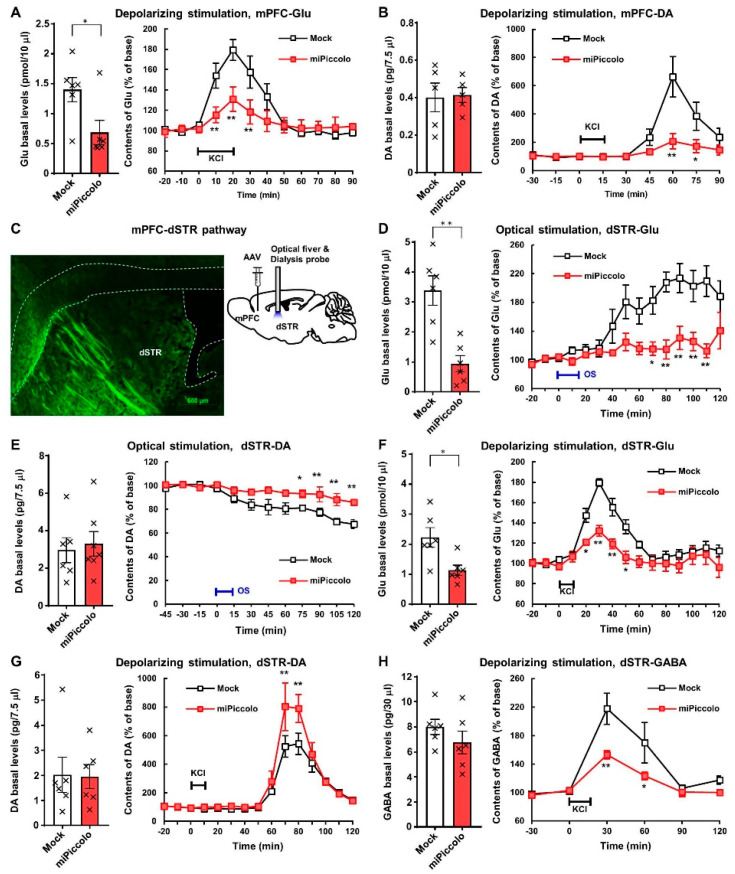
Figure 3.
In vivo brain microdialysis in the mPFC and dSTR of miPiccolo mice. (A) Left panel: Basal extracellular levels of glutamate (Glu) in the mPFC (n = 6). * p < 0.05 vs. Mock (Student’s t-test). Right panel: High K+-stimulated (100 mM, 20 min) Glu elevation in the mPFC (n = 6). ** p < 0.01 vs. Mock (ANOVA with repeated measurement followed by Bonferroni’s post-hoc test). (B) Left panel: Basal extracellular levels of dopamine (DA) in the mPFC (n = 5). Right panel: High-K+-stimulated (100 mM, 15 min) DA elevation in the mPFC (n = 5). * p < 0.05, ** p < 0.01 vs. Mock (ANOVA with repeated measurement followed by Bonferroni’s post-hoc test). (C) Left panel: A fluorescence microscopic image of GFP in the dSTR of miPiccolo mouse (sagittal section). Right panel: An image of the AAV vector injection site in the mPFC and the optical fiber and dialysis showing the cannulation site in the dSTR of the mouse. (D) Left panel: Basal extracellular levels of Glu in the dSTR (n = 6). ** p < 0.01 vs. Mock (Student’s t-test). Right panel: Change in the Glu levels by optogenetic stimulation (15 min) in the dSTR (n = 6). * p < 0.05, ** p < 0.01 vs. Mock (ANOVA with repeated measurement followed by Bonferroni’s post-hoc test). (E) Left panel: Basal extracellular levels of DA in the dSTR (n = 6). Right panel: Change in the DA levels by optogenetic stimulation (15 min) in the dSTR (n = 6). * p < 0.05, ** p < 0.01 vs. Mock (ANOVA with repeated measurement followed by Bonferroni’s post-hoc test). (F) Left panel: Basal extracellular levels of Glu in the dSTR (n = 6). * p < 0.05 vs. Mock (Student’s t-test). Right panel: High-K+-stimulated (100 mM, 10 min) Glu elevation in the dSTR (n = 6). * p < 0.05, ** p < 0.01 vs. Mock (ANOVA with repeated measurement followed by Bonferroni’s post-hoc test). (G) Left panel: Basal extracellular levels of DA in the dSTR (n = 6). Right panel: High-K+-stimulated (100 mM, 10 min) DA elevation in the dSTR (n = 6). ** p < 0.01 vs. Mock (ANOVA with repeated measurement followed by Bonferroni’s post-hoc test). (H) Left panel: Basal extracellular levels of GABA in the dSTR (n = 6). Right panel: High-K+-stimulated (100 mM, 10 min) GABA elevation in the dSTR (n = 6). * p < 0.05, ** p < 0.01 vs. Mock (ANOVA with repeated measurement followed by Bonferroni’s post-hoc test).

