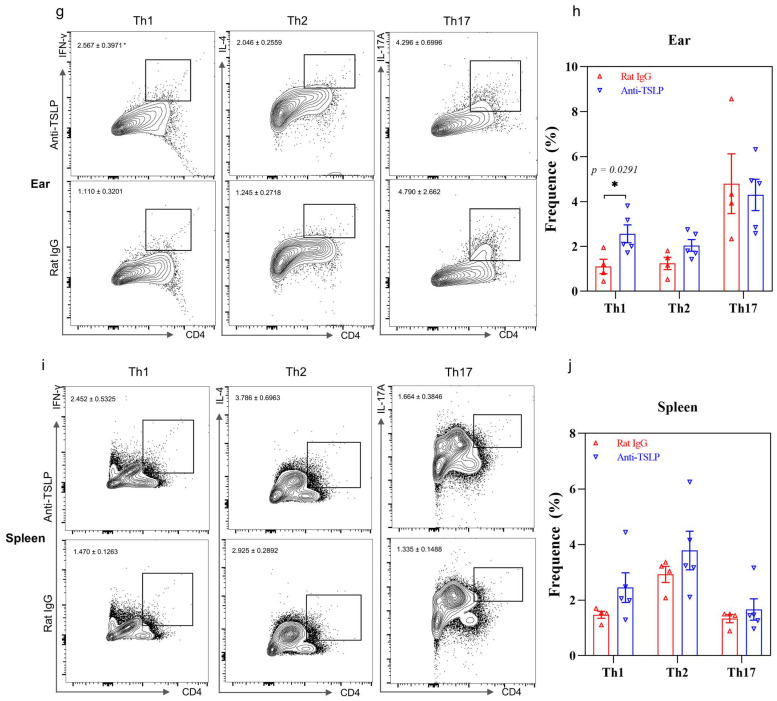
Figure 4.
Effects of the anti-TSLP treatment on AD. (a) AD murine model schedule; (b) ear swelling, skin moisture and scratching times; (c) flow cytometric analysis of basophil, eosinophil and mast cell population in the ear tissue; (d) quantitative analysis of result in (c); (e) flow cytometry analysis of basophil, eosinophil and mast cell population in the spleen; (f) quantitative analysis of result in (e); (g) flow cytometry analysis of Th1, Th2 and Th17 cell population in ear tissue; (h) quantitative analysis of result in (g); (i) flow cytometry analysis of Th1, Th2 and Th17 cell population in the spleen; (j) quantitative analysis of result in (i). Bar charts are shown as mean ± SEM of n = 4 or 5. * p < 0.05 and ** p < 0.01 when compared between the groups.


