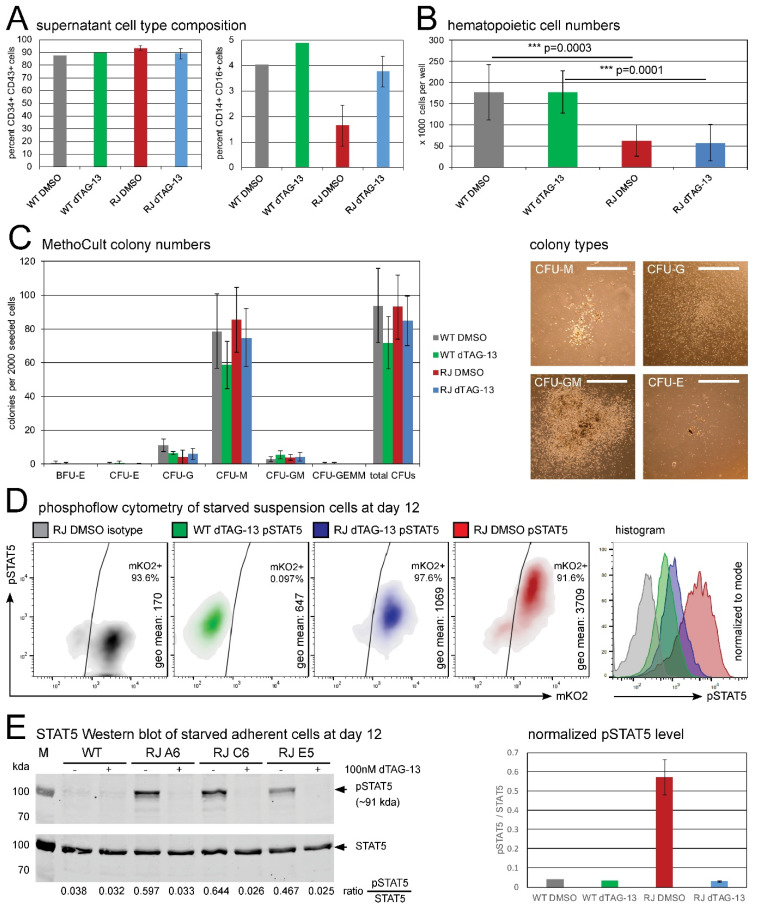
Figure 3.
Functional analyses of RUNX1-JAK2 and wild-type hematopoietic progenitor cells. (A) Supernatant cells were harvested from day 12 differentiation cultures, and flow cytometry for surface markers CD34, CD43, CD14, and CD16 was performed. Mean percentages for CD34+ CD43+ hematopoietic progenitors (left) and CD14+ CD16+ monocytes (left) are shown (wild-type, WT, n = 1; RUNX1-JAK2, RJ, n = 3; dTAG-13 or DMSO-treated cells; error bars represent standard deviations). (B) Total live suspension cells were harvested and counted (wild-type, WT, n = 5; RUNX1-JAK2, RJ, n = 13; 8 different clones; dTAG-13-treated or DMSO controls). Mean cell numbers ± standard deviation per well of a 12-well plate and adjusted p-values of the indicated comparisons are shown (analysis of variance, ANOVA; ***, very high significance). (C) MethoCult assays: 2000 supernatant cells were seeded per well of a 6-well plate in methylcellulose medium containing cytokines, and after 14 days of culture, the numbers and types of colonies were enumerated (left; WT, n = 3; RJ, n = 7, 7 different clones; BFU, burst forming unit; CFU, colony forming unit; E, erythrocyte; G, granulocyte; M, macrophage; GM, granulocyte and macrophage; GEMM, granulocyte, erythrocyte, macrophage, and megakaryocyte; means ± standard deviation). Representative pictures of different CFU types are also shown (right; white bars correspond to 1 mm). (D) Supernatant cells were starved, fixed, permeabilized, stained with an antibody specific for phosphorylated STAT5, and analyzed by flow cytometry. Density and histogram plots of intact single cells (gated according to forward and sideward scatter), pSTAT5 geometrical means, and percentages of mKO2 positivity are depicted for untreated RJ clone E5 cells (RJ DMSO, red) and controls (RJ dTAG-13, blue; WT dTAG-13, green; isotype IgG, grey). One representative result of four independent experiments is shown. (E) Western blot analysis of dTAG-13-treated or untreated WT and three clonal RJ lines (lysates of differentiated adherent cells starved for 5 h in unsupplemented IMDM) was performed for pSTAT5 and total STAT5 protein (left; kda, kilodalton). Signal ratios of phosphorylated to total STAT5 protein are presented below and summarized in a bar chart (right; means ± standard deviation). Percentages of the obtained RUNX1-JAK2-positive hemato-endothelial cells in the differentiation cultures and consequently pSTAT5 signal levels were variable.

