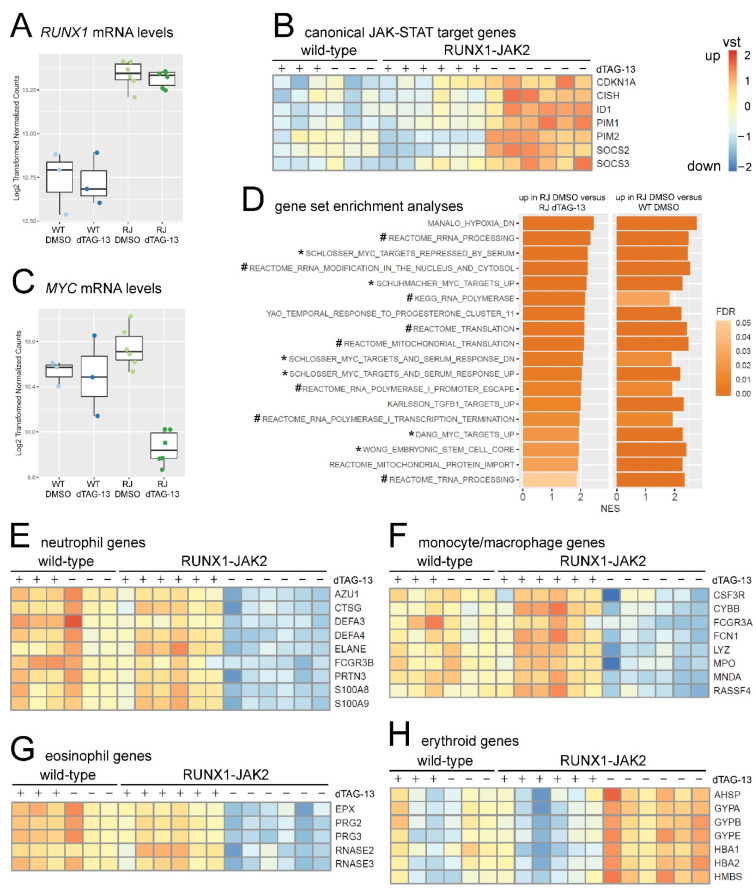
Figure 4.
Gene expression analyses of starved RUNX1-JAK2-expressing hematopoietic cells. RNA-seq was conducted with wild-type (WT, n = 3) and RUNX1-JAK2 (RJ, n = 6) cells differentiated for 12 days either with (+, dTAG-13) or without (−, DMSO) degrader treatment. (A) Boxplot showing normalized log2-transformed RUNX1 mRNA expression levels. (B) Expression profiles of canonical pSTAT5 targets. Heat-maps show batch-corrected and variance-stabilization-transformed (vst) log2-fold changes from low (blue) to high expression (orange). (C) Boxplot displaying normalized log2-transformed MYC mRNA expression levels. (D) Gene sets significantly upregulated with false discovery rate (FDR) q-values ≤ 0.05 in both enrichment analyses, untreated RJ versus dTAG-13-treated RJ and untreated RJ versus untreated WT, are listed. The x-axis represents normalized enrichment scores (NES), the brightness of the bar FDR values, gene sets directly related to MYC and RNA biology are marked with asterisks (*) and hashes (#), respectively. Expression profiles of selected significantly regulated genes related to neutrophils (E), monocytes and macrophages (F), eosinophils (G), and erythrocytes (H) are depicted.

