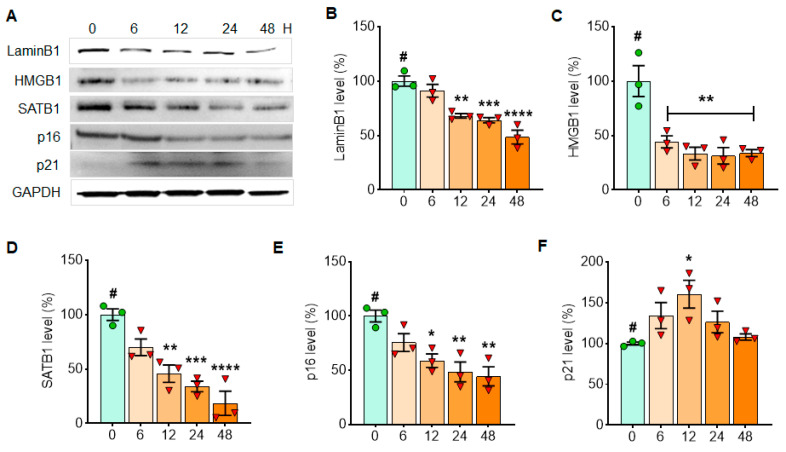
Figure 2.
α-Syn PFF treatment reduces the expressions of Lamin B1, HMGB1 and SATB1 in N27 cells, whereas it increases p21 expression in a short period of time. The examples of cellular senescence markers over 48 h are displayed in Western blots (A). The levels of LaminB1 (B), HMGB1 (C), SATB1 (D), p16 (E) and p21 (F) with α-syn PFF treatment are displayed in comparison with initial time point (T = 0). GAPDH was adopted as a loading control, and ImageJ was used for the analyses of band intensities. The relative levels (100% for no PFF treated vehicle) are displayed in mean ± SEM and applied to one-way ANOVA, Dunnett’s post-hoc test (#: compared with T = 0 point) for statistical significance. *: p < 0.05, **: p < 0.01, ***: p < 0.001 and ****: p < 0.0001.

