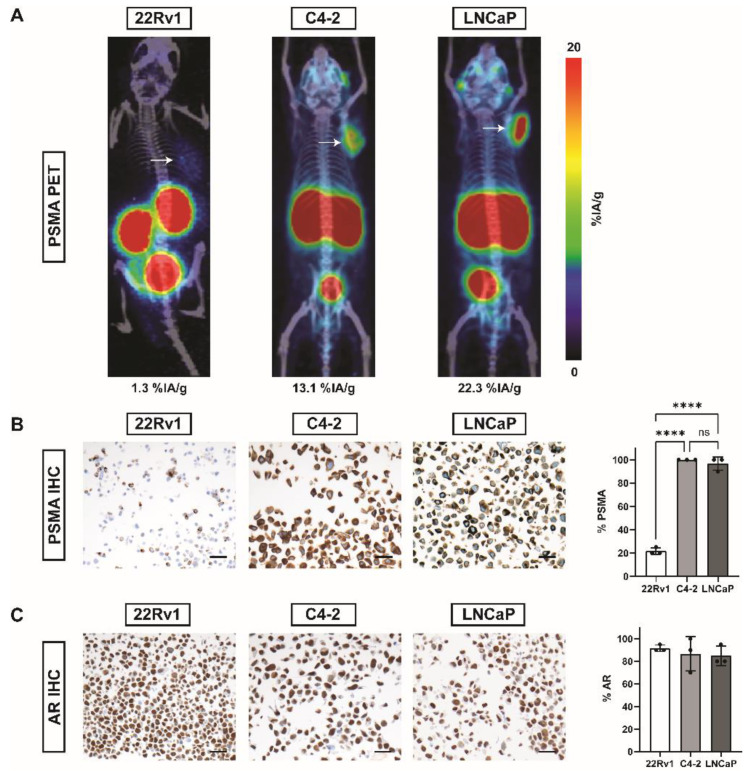
Figure 1.
PSMA and AR in 22Rv1, C4-2, and LNCaP prostate cancer cell lines by PET and IHC. (A) Exemplary 68Ga-PSMA-11-PET/CT maximum intensity projection (MIP) images of NOD/Scid mice bearing tumors (white arrows) of 22Rv1, C4-2, or LNCaP cell lines. Average tumor uptake (%IA/g) per gram tissue is stated below the image. (B) Representative images of PSMA IHC and bar plots for % positivity (mean ± SD, n = 3). (C) Representative images of AR IHC and bar plots for % positivity (mean ± SD, n = 3). Scale = 20 µm. Abbreviations: PSMA, prostate-specific membrane antigen; %IA/g, % injected activity per gram tissue; AR, androgen receptor. Statistics: ordinary one-way ANOVA with Sidak’s multiple comparisons test; **** p ≤ 0.0001; ns = non significant.

