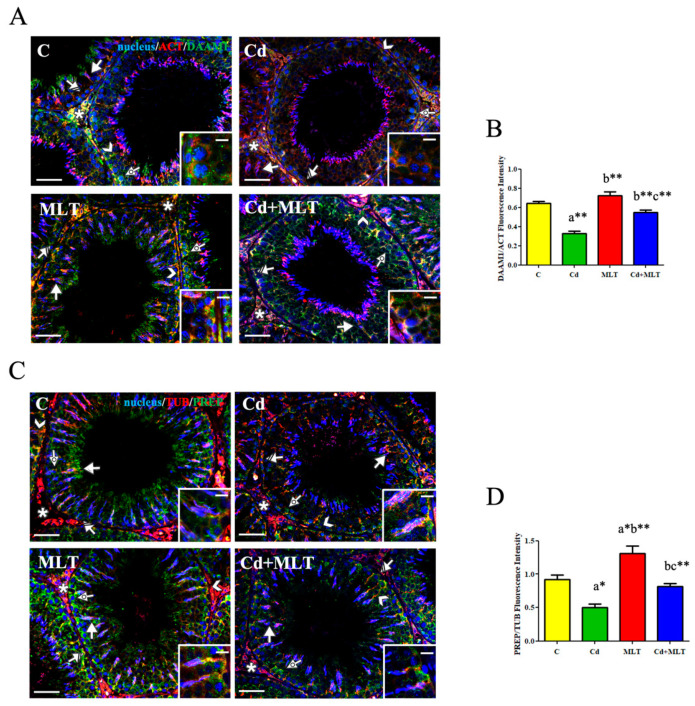
Figure 5.
IF analysis on DAAM1 and PREP of C-, Cd-, and/or MLT-treated rat testis. (A) IF analysis of DAAM1 (green) and β-actin (red) in testes of animals treated with Cd and/or MLT. Slides were counterstained with DAPI-fluorescent nuclear staining (blue). Scale bars represent 20 μm. (B) Histogram showing the quantification of DAAM1 fluorescence signal intensity using ImageJ. (C) IF analysis of PREP (green) and α-tubulin (red) in testes of animals treated with Cd and/or MLT. Slides were counterstained with DAPI-fluorescent nuclear staining (blue). Scale bars represent 20 μm and 10 μm in the insets. Striped Arrows: SPG; Dotted Arrows: SPC; Arrows: SPT; Arrowheads: SC; Asterisk: LC. (D) Histogram showing the quantification of PREP fluorescence signal intensity using ImageJ. All the values are expressed as means ± SEM from 6 animals in each group. a: significant difference versus C group, p < 0.05; b: significant difference versus Cd group, p < 0.05; c: significant difference versus MLT group, p < 0.05; *: p < 0.01; **: p < 0.001.

