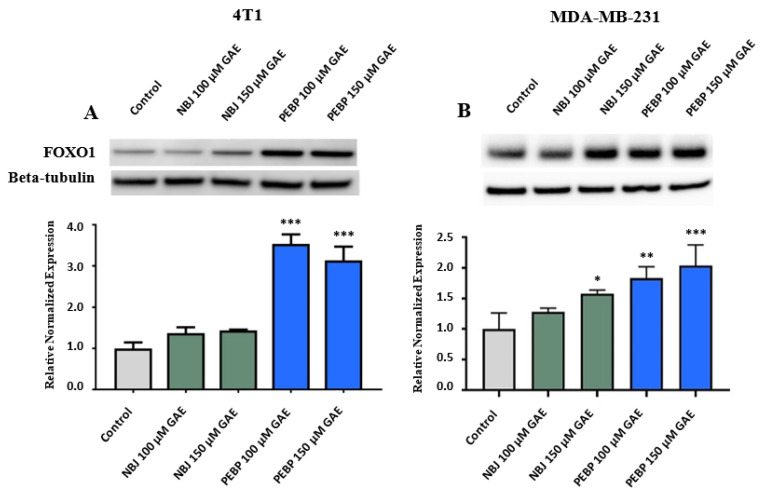
Figure 3.
Relative expression of FOXO1 in (A) 4T1 and (B) MDA-MB-231 cells exposed to 100 µM or 150 µM gallic acid equivalent (GAE) of either polyphenol-enriched blueberry preparation (PEBP) or non-fermented blueberry juice (NBJ) for 24 h. The control consisted of using the same vehicle media used for treatment groups. Western blot images are from one representative experiment. One-way ANOVA and Bonferroni’s post-hoc tests were used to compare groups. All values are mean ± SEM of 3 separate experiments. * p< 0.05, ** p < 0.01 and *** p ≤ 0.001 vs. control.

