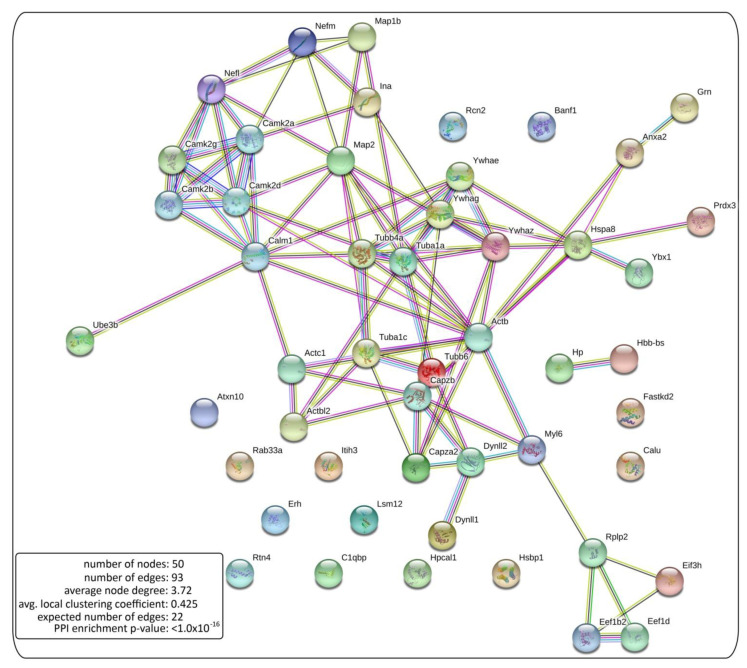
Figure 4.
NCAM2 protein interaction network. Bitmap representation of the NCAM2 interaction network. The network edges mean the evidence of interactions between the proteins of Table 1, proteins detected with two or more peptides in the mass spectrometry assay. Our bitmap shows a significant increased number of edges, 93 edges with our pull versus 22 expected in random condition.

