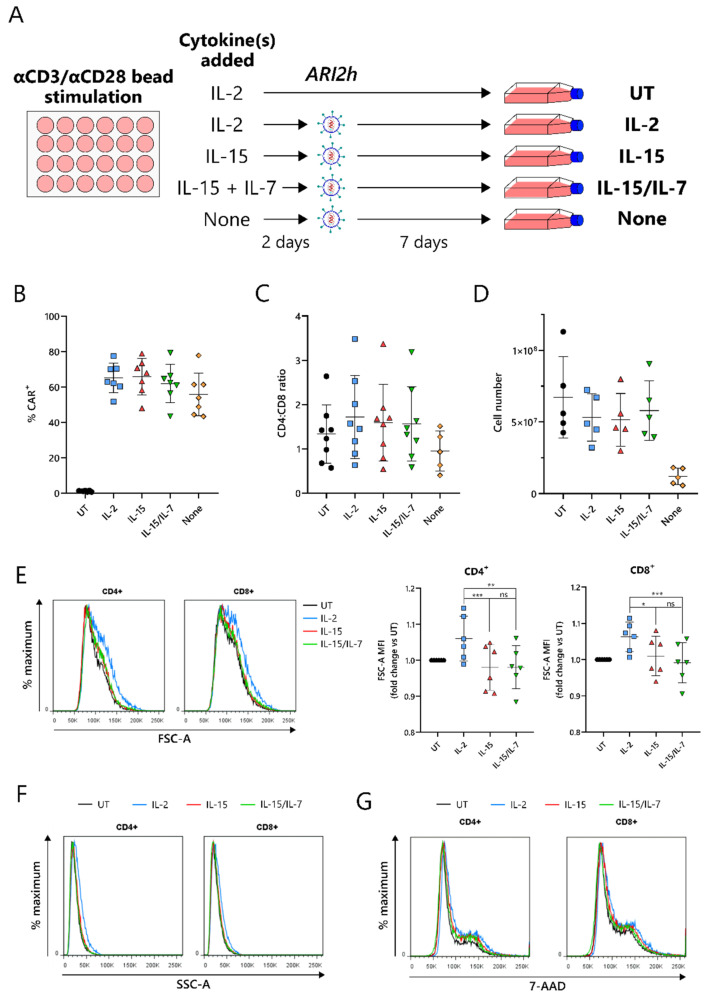
Figure 1.
IL-15-cultured ARI2h BCMA-CARs display excellent CAR expression and in vitro expansion. (A) Schematic of ARI2h cell culture protocol. (B,C) Percentage (B) and CD4+:CD8+ ratio (C) of CAR+ T cells from untransduced (UT) or transduced (ARI2hIL-2, “IL-2”; ARI2hIL-15, “IL-15”; ARI2hIL-15/IL-7, “IL-15/IL-7”, ARI2hNone, “None”) cultures, analyzed 5–7 days after transduction. (D) Cell count of UT and ARI2h cultures, analyzed 7 days after transduction. (E) Left—forward scatter (FSC-A) histogram of UT or CAR+ CD4+ and CD8+ day 9 in vitro-cultured T cells, representative of 6 experiments. Right—summary of the FSC-A median fluorescence intensity (MFI) normalized to UT. (F) Side scatter (SSC-A) histogram of UT or CAR+ CD4+ and CD8+ day 9 in vitro-cultured T cells, representative of 6 experiments. (G) 7-AAD-stained DNA content in UT or CAR+ CD4+ and CD8+ day 9 in vitro-cultured T cells. Images shown are representative histograms (n = 4). * p < 0.05; ** p < 0.01; *** p < 0.001; ns, not significant.

