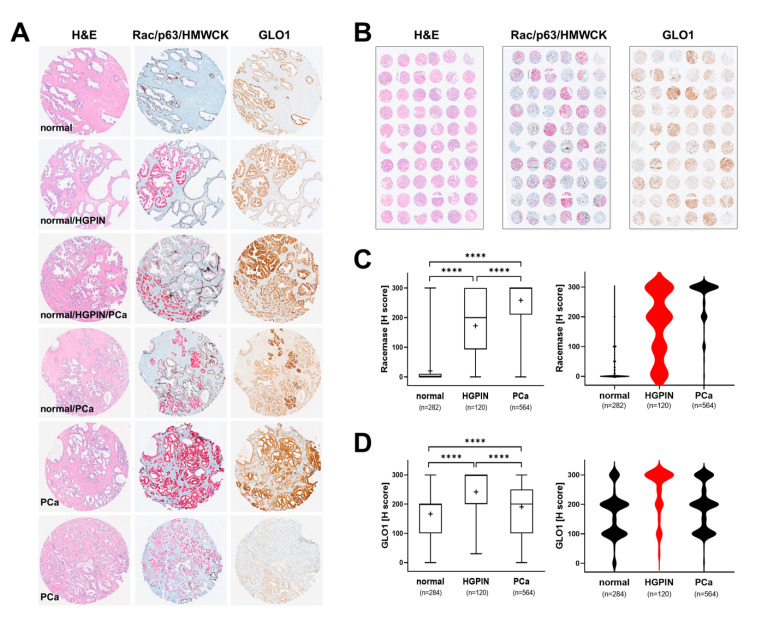
Figure 1.
Comparative immunohistochemical analysis in prostate cancer tissue specimens: GLO1 versus standard (Rac/p63/HMWCK; ‘racemase’) staining. (A) Representative cores: H&E (left column), Rac/p63/HMWCK (middle column) and GLO1 (right column). (B) Representative TMAs stained as in panel A. (C) Racemase H-score comparison between adjacent normal, HGPIN, and PCa tissues (left: box and whisker plot; right: violin plot). (D) GLO1 H-score comparison between adjacent normal, HGPIN, and PCa tissues (left: box and whisker plot; right: violin plot). Statistical analysis of data was performed using the Kruskal–Wallis test (**** p < 0.0001); ‘+’ signifies the mean; HGPIN data depicted in red.

