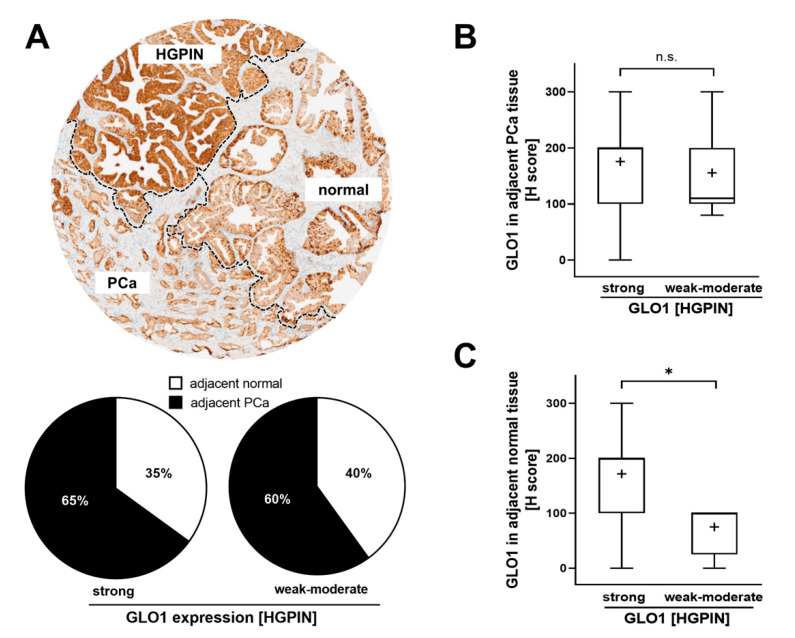
Figure 2.
GLO1 immunohistochemical staining in HGPIN as a determinant of adjacent tissue GLO1 expression. (A) A representative core with HGPIN, adjacent normal, and PCa tissue (top panel). The pie chart (bottom panel) assesses the frequency (i.e., percentage of total cores scored) of normal and PCa tissue occurring adjacent to HGPIN [stratified by GLO1 expression status in HGPIN tissue; (strong GLO1: H-score 200–300; weak–moderate GLO1: H-score < 200)]. (B) GLO1 H-score in PCa adjacent to HGPIN with altered GLO1 expression (strong versus weak–moderate). (C) GLO1 H-score in normal tissue adjacent to HGPIN with altered GLO1 expression (strong versus weak–moderate). Statistical analysis was performed using the Mann–Whitney test (* p < 0.05); ‘+’ signifies the mean.

