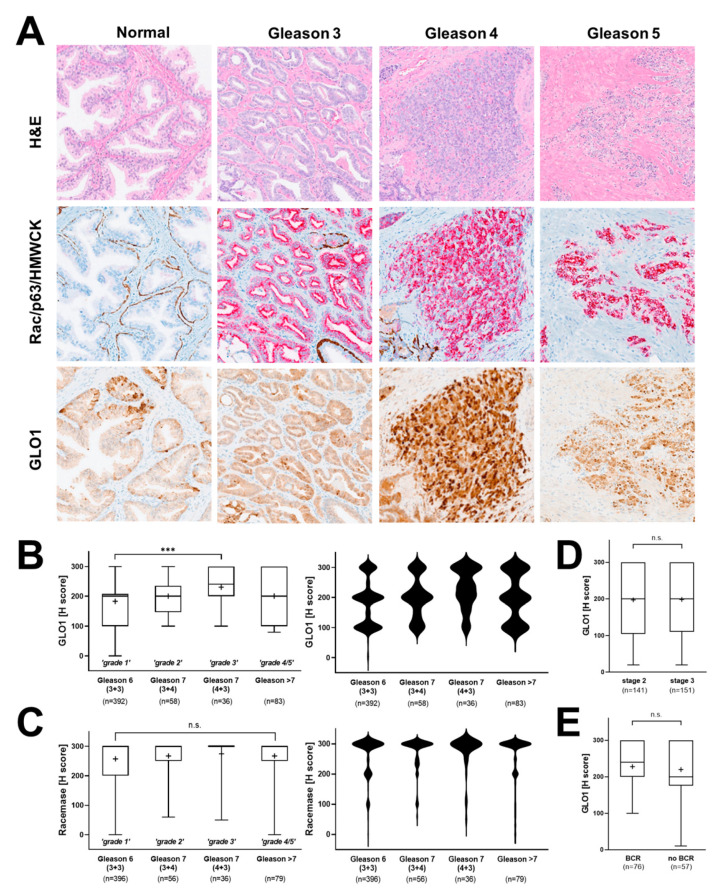
Figure 3.
Association of GLO1 immunohistochemical staining with clinical parameters of PCa. (A) Representative images depicting different Gleason patterns from the tissue cohort; H&E (left column); Rac/p63/HMWCK (middle column); GLO1 (right column). (B) GLO1 expression as a function of Gleason grade (left: box and whisker plot; right: violin plot). (C) Racemase detection as a function of Gleason grade (left: box and whisker plot; right: violin plot). (D) GLO1 immunohistochemical detection as a function of pathologic stages 2 (organ confined) and 3 (capsular penetration). (E) GLO1 detection as a function of biochemical recurrence (BCR). Statistical analysis of tissue data sets was performed using the Mann–Whitney and Kruskal–Wallis tests (*** p < 0.0005); ‘+’ signifies the mean.

