Figure 5.
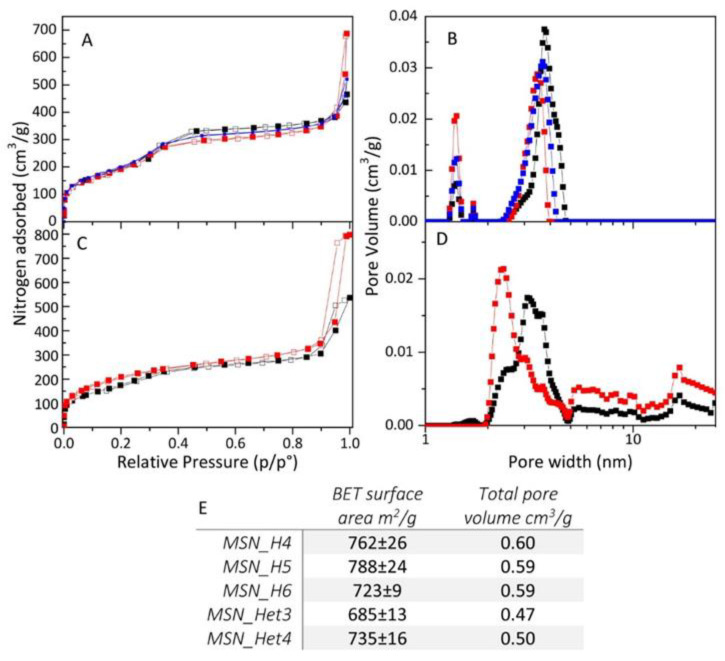
(A–C) N2 adsorption-desorption isotherms and (B,D) pore width distributions by NLDFT of MSN_H4 (panel A, B red line), MSN_H5 (panel A, B blue line), MSN_H6 (panel A, B black line), MSN_Het3 (panel C, D, black line), MSN_Het4 (panel C, D red line); (E) table of MSNs samples surface area and pore volume.

