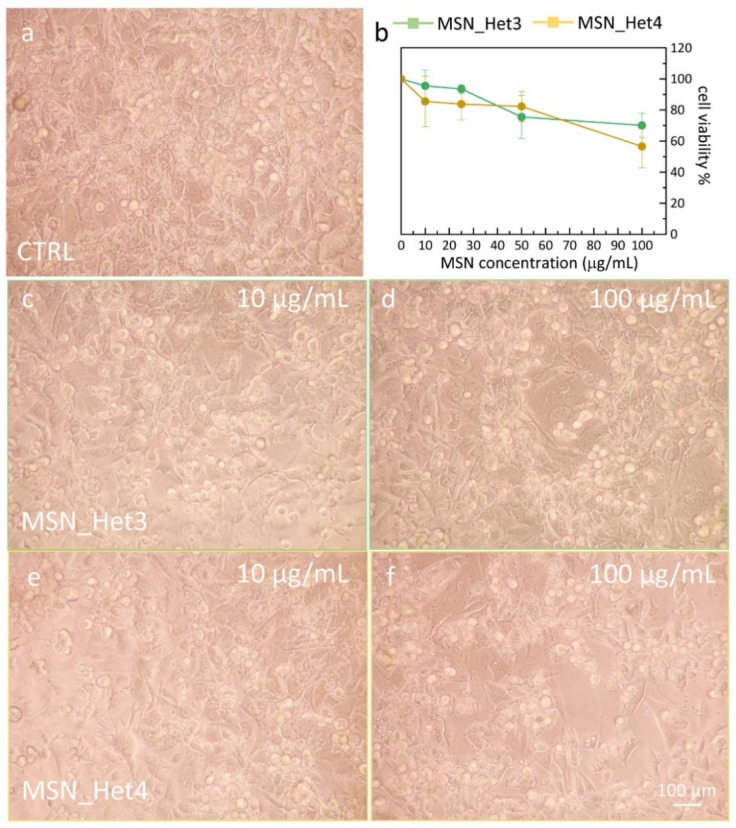
Figure 7.
(a,c–f) Representative phase contrast optical images showing the morphology of bEnd.3 (20× magnification) and of the control (CTRL, 100%) after 24 h treatment with MSN samples as labeled, prepared by the two-phase approaches, at the indicated concentrations. (b) Graph of the cell viability, determined by the MTT test, expressed as percentage of surviving cells in comparison with control (CTRL, 100%) represented by untreated bEnd.3 cells in serum-free DMEM.

