
Figure 4.
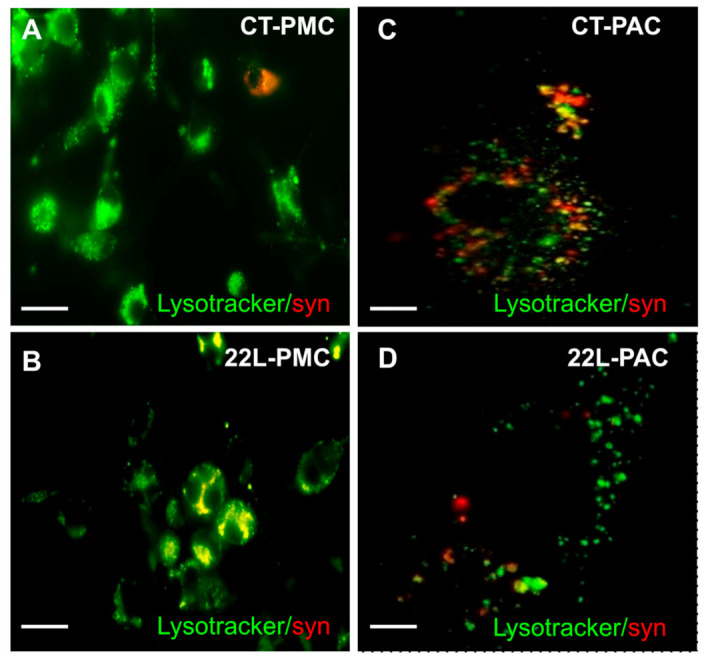
Imaging of phagocytic activity using LysoTracker assay. Representative images of CT-PMCs (A), 22L-PMCs (B), CT-PACs (C), and 22L-PACs (D) exposed to pHrodo Red-conjugated CT-syn (red) and incubated for 6 h in the phagocytic assay media containing LysoTracker Green. Scale bars = 50 µm (A,B) and 10 µm (C,D).