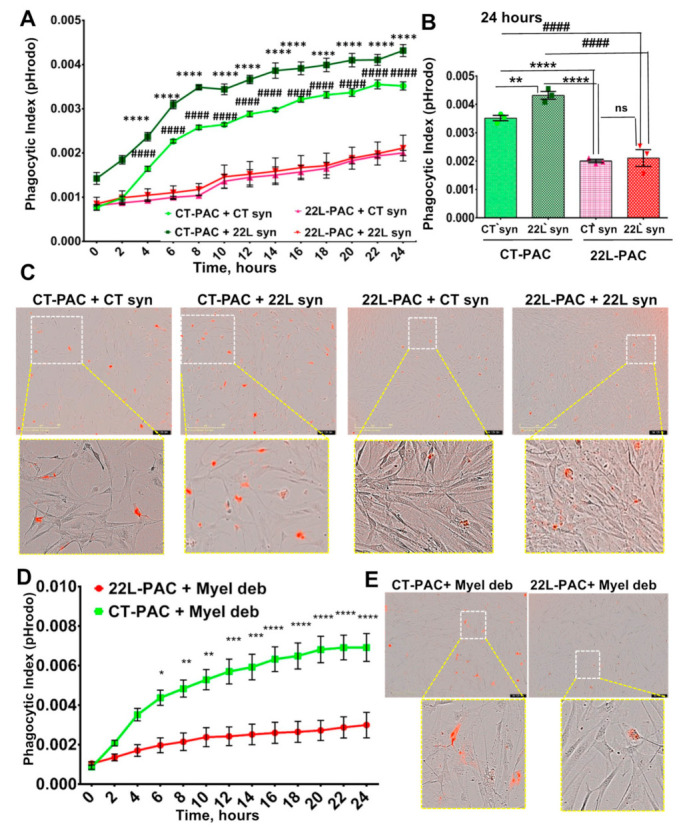
Figure 6.

Live-cell imaging of phagocytic activity of PACs from 22L-infected mice. (A) Real-time, live-cell imaging of uptake of 22L-syn or CT-syn by 22L-PACs or CT-PACs monitored by pHrodo Red fluorescence assay over the time period of 24 h. (B) Analysis of phagocytic indexes measured by live-cell pHrodo Red fluorescence assay at 24 h time point. (C) Representative overlaps of phase-contrast and fluorescence images of 22L-PACs and CT-PACs exposed to 22L-syn or CT-syn. (D) Real-time, live-cell imaging of uptake of myelin debris by 22L-PACs and CT-PACs over the time period of 24 h monitored by pHrodo Red fluorescence assay. (E) Representative overlaps of phase-contrast and fluorescence images of 22L-PACs and CT-PACs exposed to myelin debris. For all live-cell imaging assays, n = 3 22L-PAC or CT-PAC cultures, each isolated from an individual animal and cultured in three wells. For each well, four images were automatically acquired every 2 h. n = 3 independent isolations from individual animals for each 22L-syn, CT-syn, or myelin debris. Data presented as mean ± SEM. * p ≤ 0.05, ** p ≤ 0.01, *** p ≤ 0.00,1 and **** or #### p ≤ 0.0001, and ‘ns’ non-significant by a two-way ANOVA followed by Tukey’s test.
