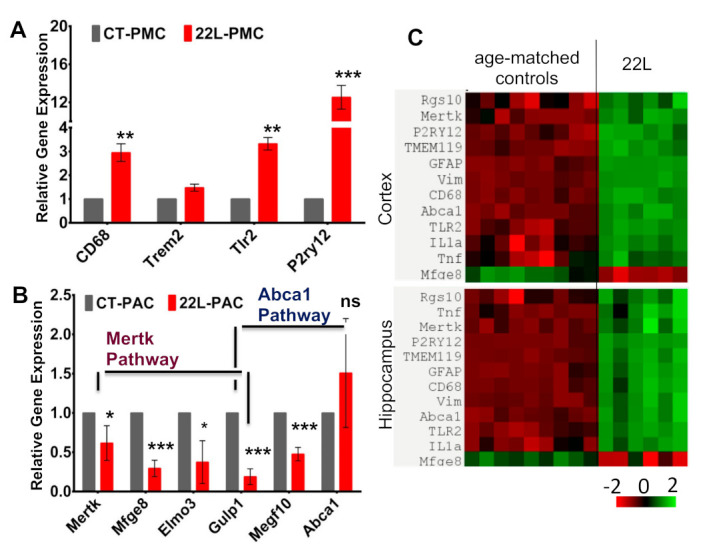
Figure 8.

Analysis of gene expression. (A,B) Expression of genes associated with phagocytosis in 22L-PMCs normalized by the expression levels in CT-PMCs (A), or 22L-PACs normalized by the expression levels in CT-PACs (B) analyzed by qRT-PCR. Gapdh was used as the housekeeping gene. Data represent mean ± SEM, n = 3 independent cultures isolated from individual animals, each analyzed in triplicates, * p ≤ 0.05, ** p ≤ 0.01, *** p ≤ 0.001, and ‘ns’ non-significant by a two-tailed, unpaired student t-test. (C) Heat map of gene expression in cortex and hippocampus of 22L-infected and age-matched control mice (n = 6 animals per group).
