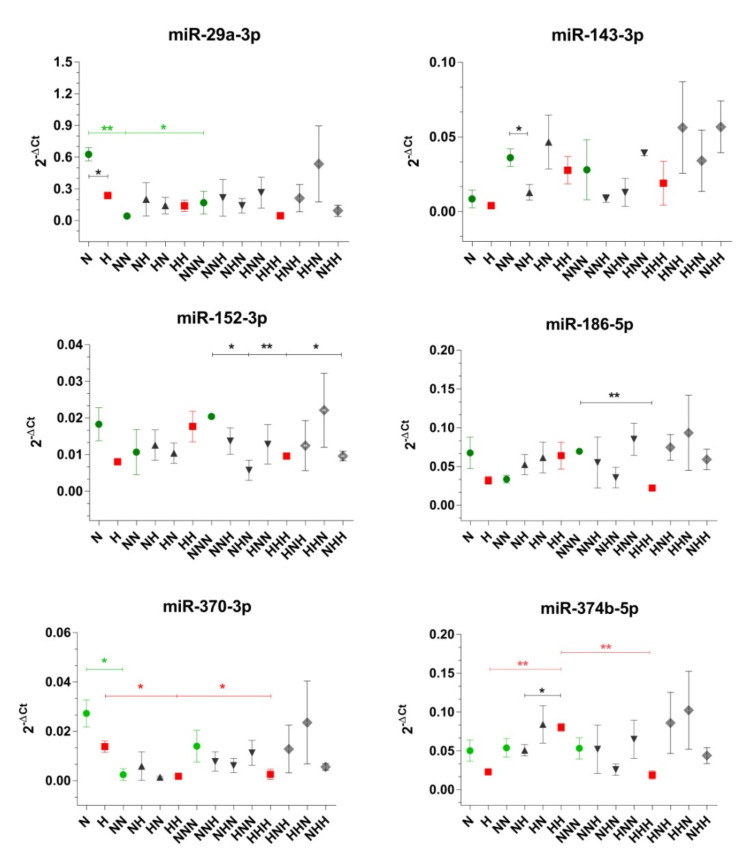
Figure 3.
Expression profiles of miR-29a-3p, miR-143-3p, miR-152-3p, miR-186-5p, miR-370-3p and miR-374b-5p evaluated after completion of proliferation, differentiation, and maturation of visceral cells cultured in chronic/intermittent normoglycemic (N) and hyperglycemic (H) conditions. Data are expressed as mean ± SEM in green (NG), red (chronic HG), dark grey (single HG hit), and light grey (double HG hit). Differences in expression levels between two particular culture variants were evaluated using a two-tailed t-test. One-way ANOVA with a post-hoc Tukey test was used for the calculation of statistical significance of changes observed during ADG in NG and HG. (**): p ≤ 0.01; (*): p ≤ 0.05.

