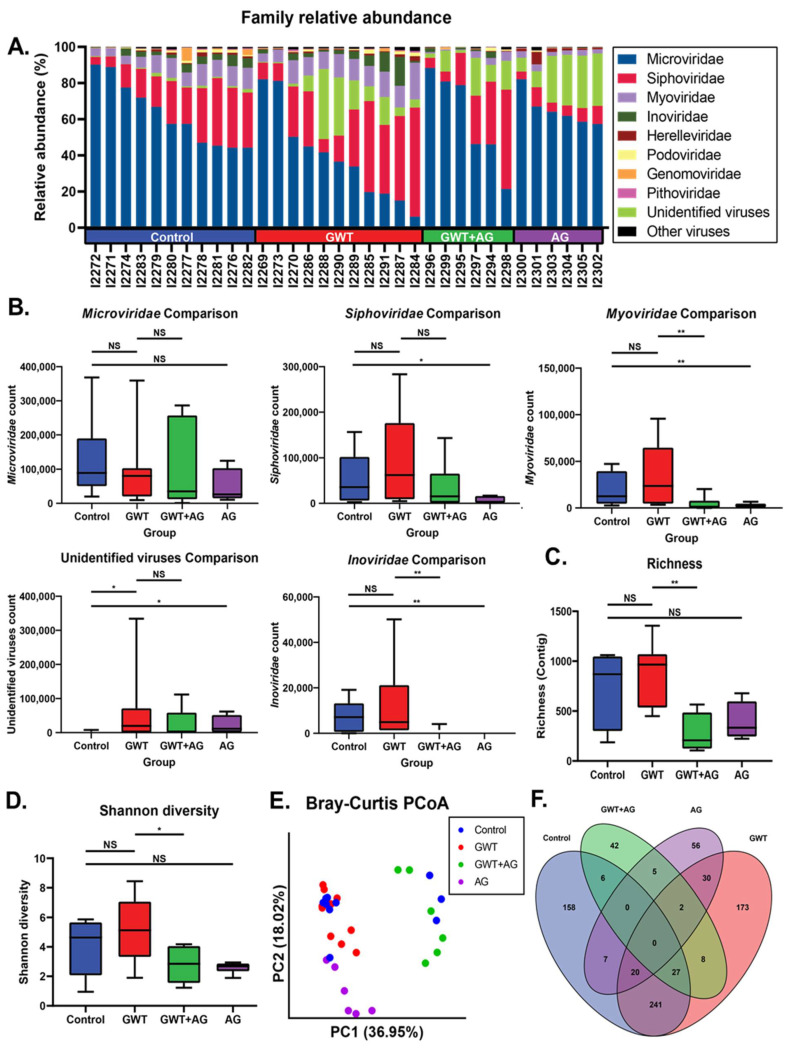
Figure 2.
Virome composition and analysis of mice under different GW chemical exposure conditions. (A) Relative abundance of most abundant viral families for all mice in the cohort. (B) Boxplots of Microviridae, Siphoviridae, Myoviridae, and Inoviridae NGS RPK counts between treatment groups. Statistical significance was assessed by a Mann–Whitney U test (* p < 0.05, ** p < 0.01, NS: non-significant). (C) Boxplot of viral contig richness between treatment groups. Statistical significance was assessed by Mann–Whitney U test (** p < 0.01, NS: non-significant). (D) Boxplot of Shannon diversity between treatment groups. Statistical significance was assessed by Mann–Whitney U test. (* p < 0.05, NS: non-significant) (E) Principal coordinate analysis plot of Bray–Curtis distances of samples colored by treatment group. (F) Venn diagram of LEfSe analysis of pairwise comparisons between treatment groups. Overlapping regions indicate shared discriminant features between groups.

