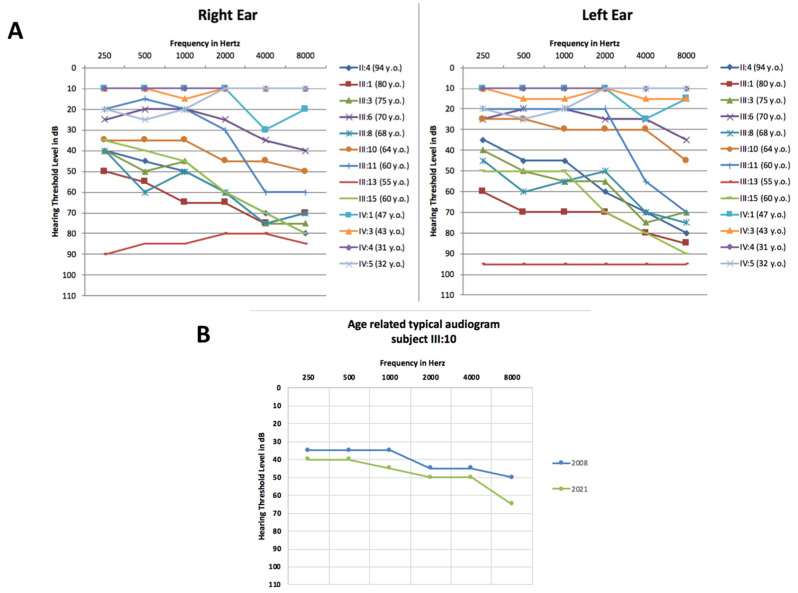
Figure 2.
Audiograms of the Italian family. (A) Audiometric features, displayed as audiograms, were available for twelve members of the family. The thresholds of the right and left ears are shown for each patient. The audiometric patterns for patients IV:3 and IV:4 partially overlap. (B) Example of the progression of the hearing loss for patient III:10. In blue is displayed an audiogram performed in 2008, and in green, one of 2021 (Age-Related Typical Audiogram (ARTA)). Only the data for the best ear are reported.

