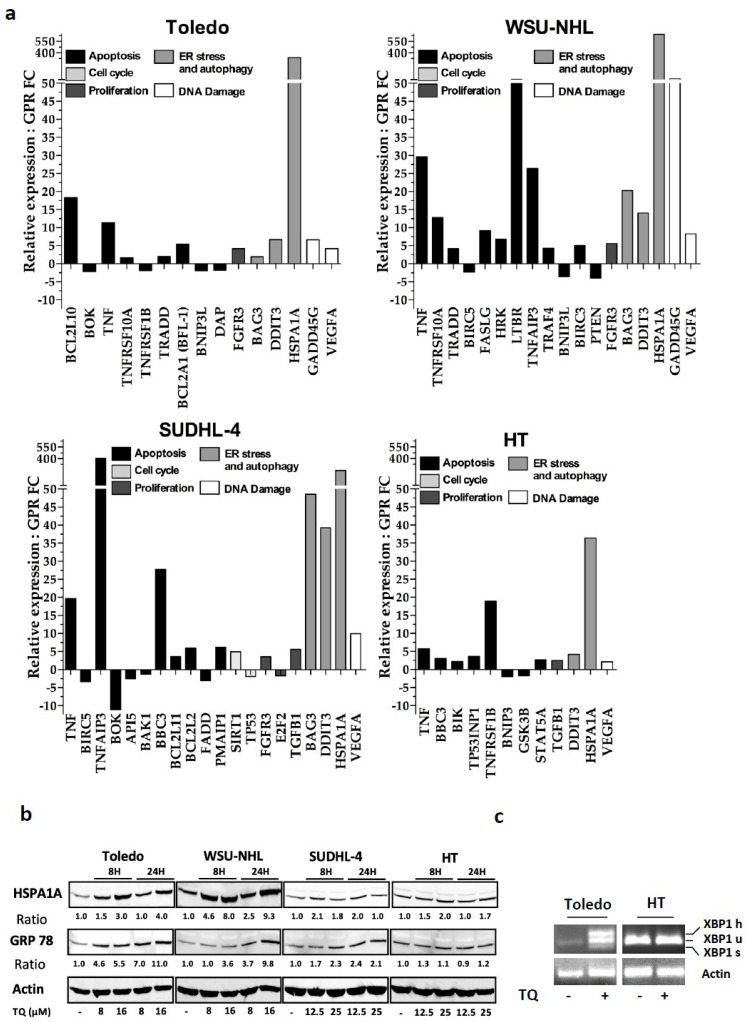
Figure 3.
Molecular pattern associated with cell line responsiveness to TQ. (a) Effect of TQ on common genes related to proliferative and cell death pathways: cDNA-reversed RNA from cells treated with the vehicle or 25 µM TQ for 4 h were submitted to qPCR analysis using commercialized plates for gene pattern analysis. The graphs represent the significant transcriptionally up- and downregulated genes in the different cell lines. Values represent fold changes in gene expression between control and treated groups. The means of significant genes from three independent experiments are shown, with a minimal cut-off of 1.5. (b,c) Effect of TQ on ER stress. (b) Cells were treated with the indicated doses of TQ for 8 h and 24 h. WB was then performed using antibodies against GRP78 and HSPA1A, and actin was used as the loading control. (c) Detection of XBP-1 splicing via semiquantitative RT–PCR on total RNA extracted from Toledo and HT cells treated with 25 μM TQ. The represented PCR products are XBP1u (unspliced XBP1), XBP1s (spliced XBP1), and XBP1h (hybrid XBP1); actin was used as the loading control.

