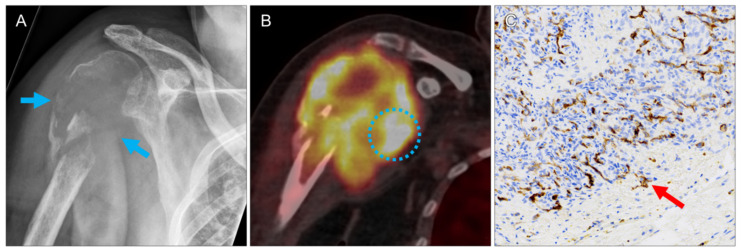
Figure 1.
Large osteolytic ccRCC bone metastasis (lesion 8). X-ray shows destruction of the proximal right humerus ((A), arrows). PET/CT reveals extensive soft tissue infiltration of the lesion (B)), with the highest tracer uptake observed in this study (circle; SUVmax 23.4). Intense PSMA expression on the microvasculature of the mass ((C), brown structures, arrow). No intact bone structures were seen in this biopsy specimen.

